Fig. 4
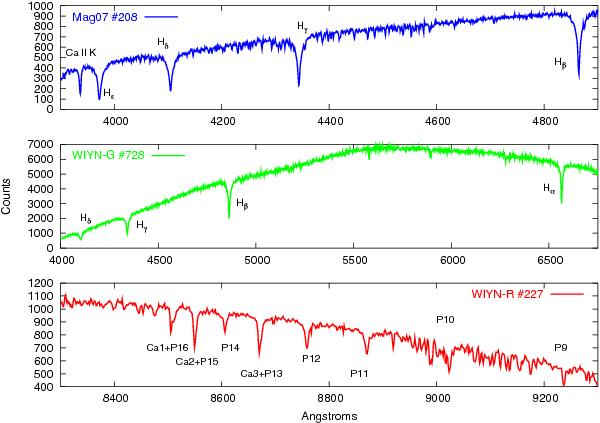
Example of reduced spectra of RRLS taken with some of the telescopes/setup combinations used for this project. The panels display the three wavelength ranges in use and identify typical spectral features in each of them. The telescope/setup labelling in each panel follows the code defined in Table 1.
Current usage metrics show cumulative count of Article Views (full-text article views including HTML views, PDF and ePub downloads, according to the available data) and Abstracts Views on Vision4Press platform.
Data correspond to usage on the plateform after 2015. The current usage metrics is available 48-96 hours after online publication and is updated daily on week days.
Initial download of the metrics may take a while.