Fig. 2
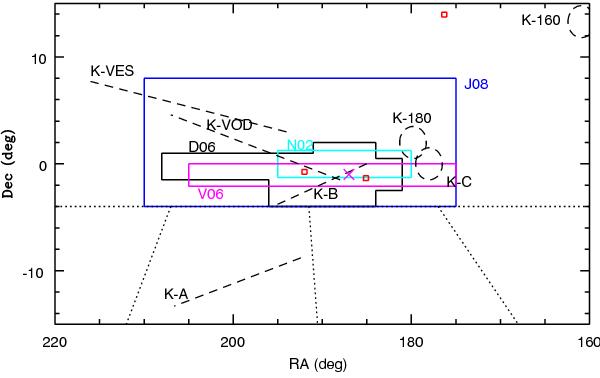
Distribution in the sky of the different photometric detections of sub-structures in
the Virgo region. The dotted horizontal line at Dec = −4° represents the rough southern
limit of the SDSS imaging survey. There are also 3 SEGUE imaging stripes that cross
the region at negative declinations as shown by the other dotted lines. Labels
correspond to the following references: N02, Newberg
et al. (2002); V06, Vivas & Zinn
(2006); D06, Duffau et al. (2006);
J08, Jurić et al. (2008); K-A, K-B and K-C,
Keller et al. (2008, 2009); K-VOD, K-VES, K-160 and K-180, Keller (2010). The small squares represent the fields observed by
Jerjen et al. (2013); the one at (RA, Dec)
 coincides with the location of Vir
Z (Walsh et al. 2009). The × symbol shows the densest part of the
overdensity as seen in RRLS in the QUEST survey.
coincides with the location of Vir
Z (Walsh et al. 2009). The × symbol shows the densest part of the
overdensity as seen in RRLS in the QUEST survey.
Current usage metrics show cumulative count of Article Views (full-text article views including HTML views, PDF and ePub downloads, according to the available data) and Abstracts Views on Vision4Press platform.
Data correspond to usage on the plateform after 2015. The current usage metrics is available 48-96 hours after online publication and is updated daily on week days.
Initial download of the metrics may take a while.