Fig. 11
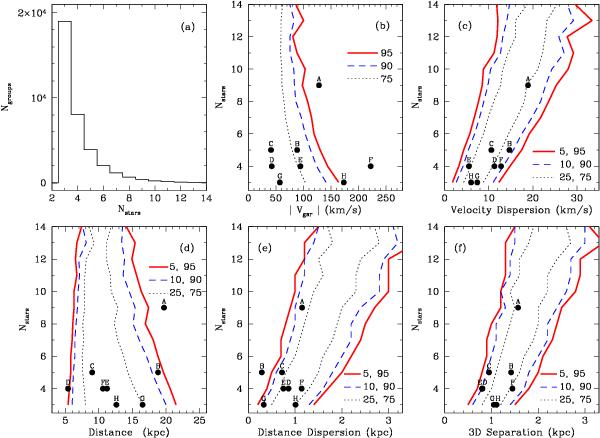
Properties of the groups found in the simulated samples using ϵ = 0.046. a) Distribution of the number of stars in the groups. Lines in panels b)–f) indicate the percentiles 5, 10, 25, 75, 90 and 95 of the distribution of radial velocity b), velocity dispersion c), distance d), distance dispersion e) and 3D separation f), for groups having Nstars members. For the velocity distribution b) the x axis shows the absolute value of the velocity and hence, only the percentiles 75, 90 and 95 are indicated. Panels b) to f) show the location of groups A to H (Table 8) as solid circles.
Current usage metrics show cumulative count of Article Views (full-text article views including HTML views, PDF and ePub downloads, according to the available data) and Abstracts Views on Vision4Press platform.
Data correspond to usage on the plateform after 2015. The current usage metrics is available 48-96 hours after online publication and is updated daily on week days.
Initial download of the metrics may take a while.