Free Access
Fig. 5
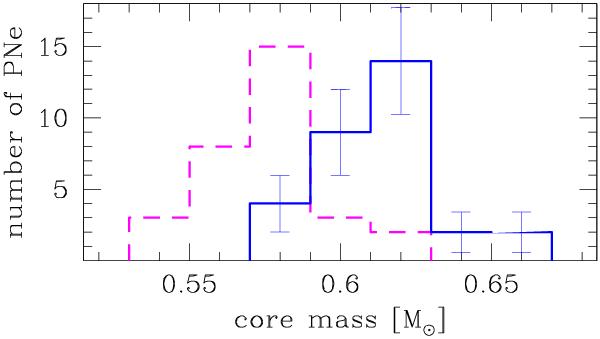
Masses of the PN central stars for the 31 objects studied here with HST and VLT data. The solid (blue) line shows the data obtained from Eq. (2); the dashed (magenta) line presents the masses obtained from accelerated post-AGB evolution (see further in the text). One-sigma errors are indicated.
Current usage metrics show cumulative count of Article Views (full-text article views including HTML views, PDF and ePub downloads, according to the available data) and Abstracts Views on Vision4Press platform.
Data correspond to usage on the plateform after 2015. The current usage metrics is available 48-96 hours after online publication and is updated daily on week days.
Initial download of the metrics may take a while.