Fig. 4
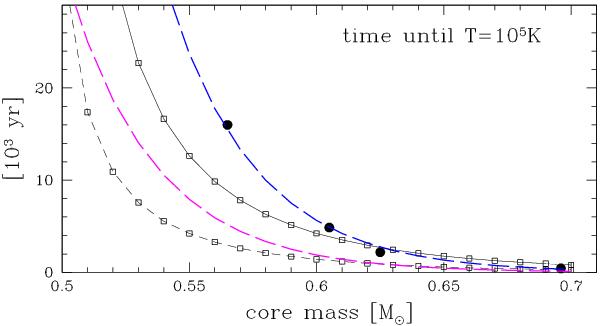
Post-AGB time scale for the star to reach T = 105 K is plotted against core mass. The filled circles show the Blöcker model set. The upper long-dash line (blue) correspond to the interpolated formula of Eq. (2), and the lower long-dashed line (magenta) is for the accelerated evolution of Eq. (11). The solid line (with squares) shows the envelope-mass parametrization of Sect. 3.5, and the short-dashed line (with squares) shows this parametrization with envelope masses at the end of the transition phase reduced by a factor of three.
Current usage metrics show cumulative count of Article Views (full-text article views including HTML views, PDF and ePub downloads, according to the available data) and Abstracts Views on Vision4Press platform.
Data correspond to usage on the plateform after 2015. The current usage metrics is available 48-96 hours after online publication and is updated daily on week days.
Initial download of the metrics may take a while.