Fig. 2
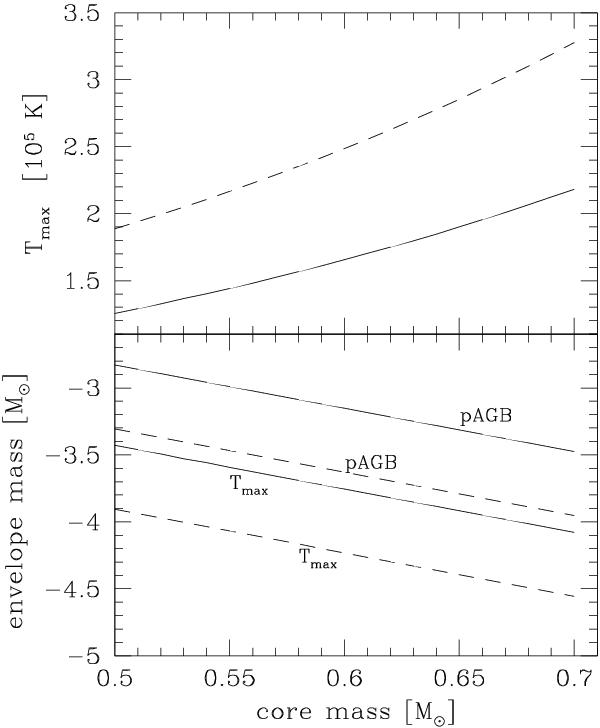
Dependence of the post-AGB maximum temperatures Tmax and envelope masses on the core mass, based on the relations in Sect. 3.4. The solid lines show the parametrization, which are fitted to the Blöcker models. The short-dashed lines show the result of reducing the envelope masses at the end of the transition phase by a factor of three. In the bottom panel, we show the envelope mass at the start of the post-AGB evolution and at the time of maximum stellar temperature.
Current usage metrics show cumulative count of Article Views (full-text article views including HTML views, PDF and ePub downloads, according to the available data) and Abstracts Views on Vision4Press platform.
Data correspond to usage on the plateform after 2015. The current usage metrics is available 48-96 hours after online publication and is updated daily on week days.
Initial download of the metrics may take a while.