Fig. A.1
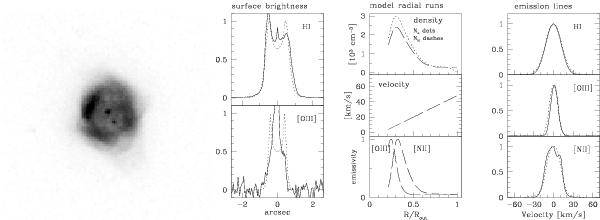
Nebula H 1-55 (PN G 001.7−04.4). The left panel shows the HST Hα image in linear grey scale, which is rotated so that the VLT spectrograph slit runs horizontally through the centre. In the small panels, the observed data are drawn in solid lines (as a rule), while model fits and model parameters are in dotted and dashed lines. The “surface brightness” panel shows the horizontal slices through the Hα and [O iii] image centre (averaged over nine pixels) with the model brightness profile superposed. Next, the radial distributions of the best-fit model for selected parameters are shown. The right-most panel shows the emission lines observed at the VLT with the superposed modelled line profiles corrected for instrumental broadening of 0.1 Å.
Current usage metrics show cumulative count of Article Views (full-text article views including HTML views, PDF and ePub downloads, according to the available data) and Abstracts Views on Vision4Press platform.
Data correspond to usage on the plateform after 2015. The current usage metrics is available 48-96 hours after online publication and is updated daily on week days.
Initial download of the metrics may take a while.