Fig. 16
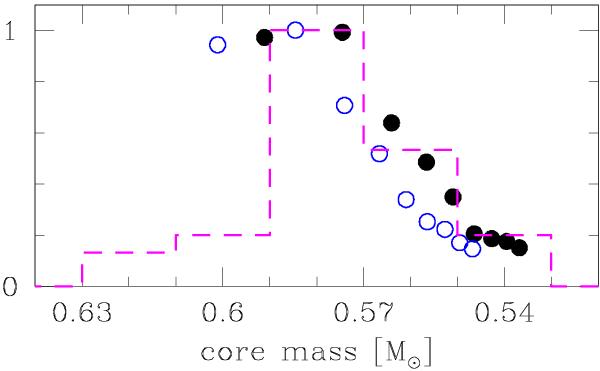
Open circles show the core-mass distribution (normalized to unity) obtained from a constant SFH, which was backward-corrected for visibility time and for the PNe birth rate at the points indicated in Fig. 15. The mass-axis is drawn in reverse order to allow a direct correspondence of the large dots from left to right in both figures. For comparison the dashed line shows the final mass distribution repeated from Fig. 5. The filled circles represent the same data points as open circles but obtained with modified IFMR defined by Eq. (15).
Current usage metrics show cumulative count of Article Views (full-text article views including HTML views, PDF and ePub downloads, according to the available data) and Abstracts Views on Vision4Press platform.
Data correspond to usage on the plateform after 2015. The current usage metrics is available 48-96 hours after online publication and is updated daily on week days.
Initial download of the metrics may take a while.