Fig. 15
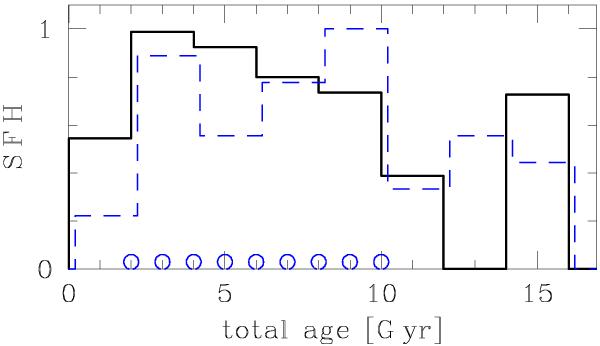
Star-formation history for the GB derived from the right panel of Fig. 14, which is corrected for visibility time and PNe birth rate. A dashed (blue) line, which is slightly shifted for a better presentation, shows the overplotted histogram from Bensby et al. (2013) for the bulge stars, excluding the most metal-poor objects. The open circles represent the points at which a constant SFH was backward-corrected for visibility time and PNe birth rate, as shown in Fig. 16.
Current usage metrics show cumulative count of Article Views (full-text article views including HTML views, PDF and ePub downloads, according to the available data) and Abstracts Views on Vision4Press platform.
Data correspond to usage on the plateform after 2015. The current usage metrics is available 48-96 hours after online publication and is updated daily on week days.
Initial download of the metrics may take a while.