Fig. 14
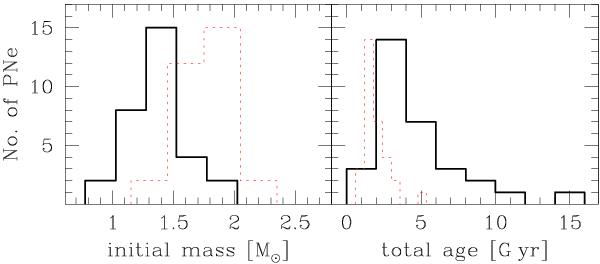
Histograms of the interpolated data. The left panel shows the initial ZAMS masses, and the right panel shows the ages since the ZAMS was used later to derive a star-formation history (see Fig. 15). The solid lines represent the data obtained with IFMR defined by Eq. (14), while the thin dotted (red) lines repeat the histograms from Fig. 8 for comparison.
Current usage metrics show cumulative count of Article Views (full-text article views including HTML views, PDF and ePub downloads, according to the available data) and Abstracts Views on Vision4Press platform.
Data correspond to usage on the plateform after 2015. The current usage metrics is available 48-96 hours after online publication and is updated daily on week days.
Initial download of the metrics may take a while.