Fig. 4
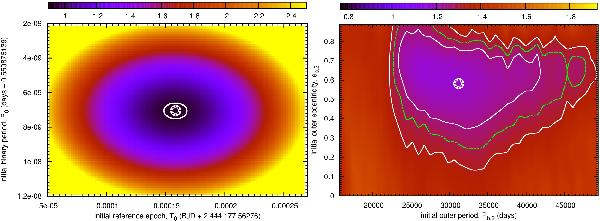
Two-dimensional parameter scans of the  statistic in a
neighborhood around the best-fit model (marked with an asterisk) considering the
two-companion model. The color-bar is scaled with the value of our best-fit model
representing 1. Countour lines show the 1-σ (left panel) and 1-, 2-,
3-σ
(right panel) confidence level curves around the best-fit model.
(Color version online.)
statistic in a
neighborhood around the best-fit model (marked with an asterisk) considering the
two-companion model. The color-bar is scaled with the value of our best-fit model
representing 1. Countour lines show the 1-σ (left panel) and 1-, 2-,
3-σ
(right panel) confidence level curves around the best-fit model.
(Color version online.)
Current usage metrics show cumulative count of Article Views (full-text article views including HTML views, PDF and ePub downloads, according to the available data) and Abstracts Views on Vision4Press platform.
Data correspond to usage on the plateform after 2015. The current usage metrics is available 48-96 hours after online publication and is updated daily on week days.
Initial download of the metrics may take a while.