Free Access
Fig. 3
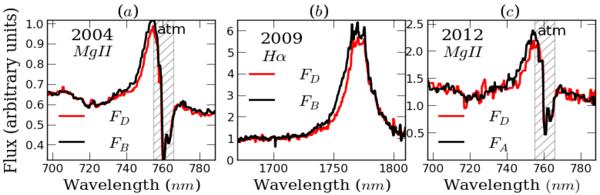
a) Comparison of the MgII line profiles in images B and D, observed in 2004. b) Comparison of the Hα line profiles of images B and D, observed in 2009. c) Comparison of the MgII line profiles of images A and D, observed in 2012. In every panel, the continua have been scaled so that they overlap.
Current usage metrics show cumulative count of Article Views (full-text article views including HTML views, PDF and ePub downloads, according to the available data) and Abstracts Views on Vision4Press platform.
Data correspond to usage on the plateform after 2015. The current usage metrics is available 48-96 hours after online publication and is updated daily on week days.
Initial download of the metrics may take a while.