Fig. 2
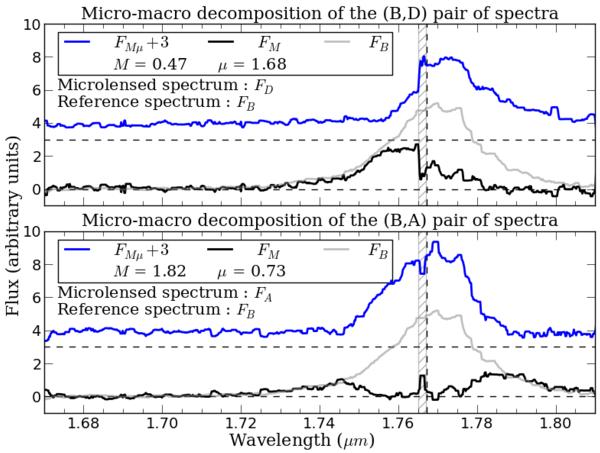
Upper panel: decomposition of the quasar spectrum into a macrolensed-only component (FM, black line) and a component both macro- and microlensed (FMμ, blue line) by applying MmD to the spectra of images B and D. FMμ is shifted upward by three units. The spectrum of image B (FB, grey line), assumed to be unaltered by microlensing, is shifted downward till its continuum intensity is null and is superimposed on FM. The spectra are filtered with a five-pixel-wide median filter for clarity. The vertical dotted line indicates the redshifted rest wavelength of the Hα line. Lower panel: same for the pair of spectra of images B and A.
Current usage metrics show cumulative count of Article Views (full-text article views including HTML views, PDF and ePub downloads, according to the available data) and Abstracts Views on Vision4Press platform.
Data correspond to usage on the plateform after 2015. The current usage metrics is available 48-96 hours after online publication and is updated daily on week days.
Initial download of the metrics may take a while.