Fig. 1
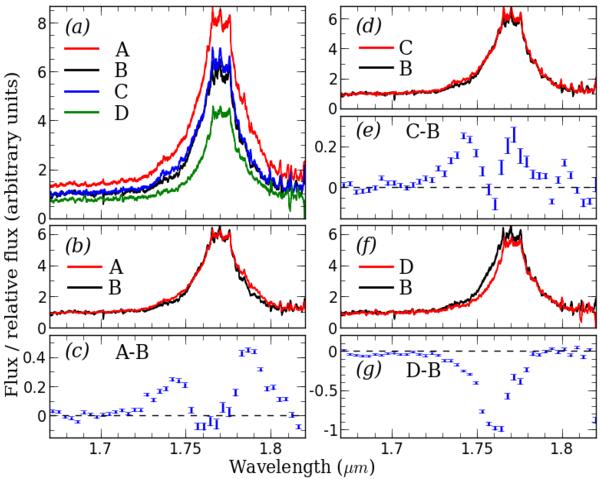
a) Median spectra of the QSO-lensed images. b) The spectra of images A and B normalized so that their continua have a unit average intensity and are superimposed, and c) the spectral differences between the Hα line profiles in the normalized spectra of images A and B, plotted with error bars for a wavelength bin of 0.004μm. d), e) Same for the pair of images B and C. f), g) Same for the pair of images B and D. Spectra have been filtered with a five-pixel-wide median filter for clarity.
Current usage metrics show cumulative count of Article Views (full-text article views including HTML views, PDF and ePub downloads, according to the available data) and Abstracts Views on Vision4Press platform.
Data correspond to usage on the plateform after 2015. The current usage metrics is available 48-96 hours after online publication and is updated daily on week days.
Initial download of the metrics may take a while.