Fig. 3
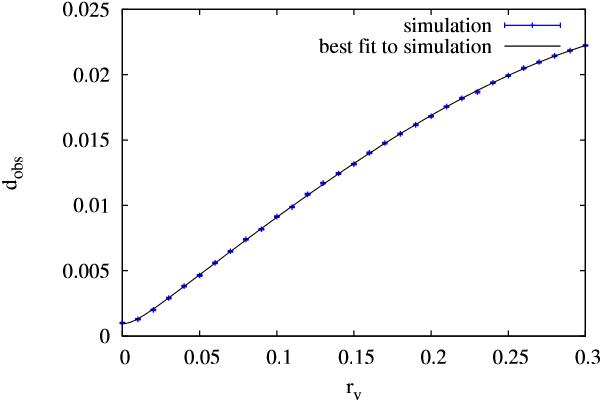
Simulated dipole amplitudes. The graph is for a void with Rv = 0.3 and δ = −1 for different values of rv. Each data point is the mean value of the dipole amplitude from 100 simulations with 106 sources each, while the curve is the best fit. The error bars represent the empirical variance of these simulations. For the fit, a function  was used.
Current usage metrics show cumulative count of Article Views (full-text article views including HTML views, PDF and ePub downloads, according to the available data) and Abstracts Views on Vision4Press platform.
Data correspond to usage on the plateform after 2015. The current usage metrics is available 48-96 hours after online publication and is updated daily on week days.
Initial download of the metrics may take a while.