Free Access
Fig. 3
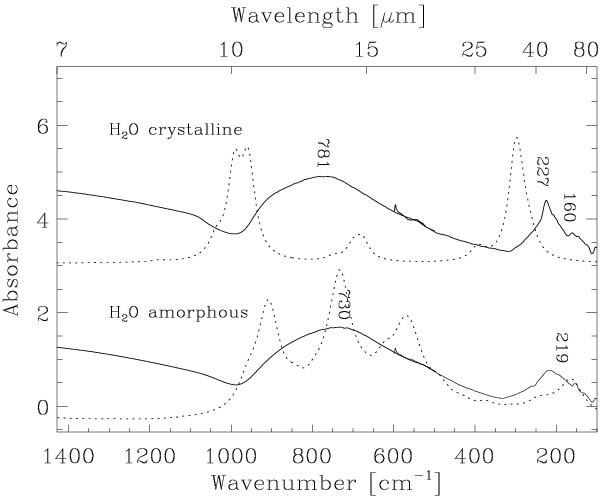
Experimental (solid line) and calculated (dotted line) IR spectrum of H2O ice. The laboratory spectrum of amorphous H2O was deposited and recorded at 8 K, while the crystalline spectrum of H2O was obtained after warming up to 150 K.
Current usage metrics show cumulative count of Article Views (full-text article views including HTML views, PDF and ePub downloads, according to the available data) and Abstracts Views on Vision4Press platform.
Data correspond to usage on the plateform after 2015. The current usage metrics is available 48-96 hours after online publication and is updated daily on week days.
Initial download of the metrics may take a while.