Fig. 9
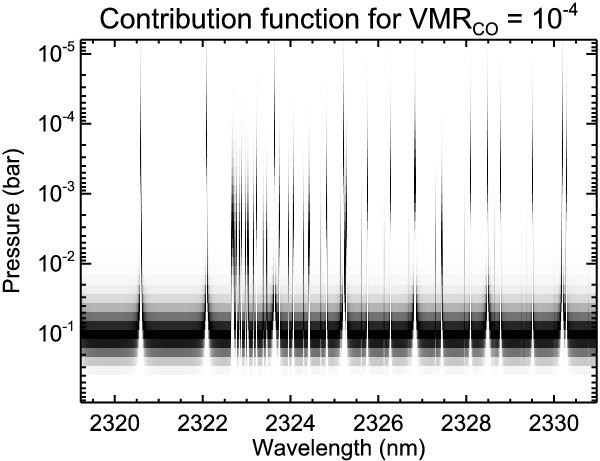
Contribution function for the model spectrum of HD 179949 b computed with the Burrows et al. (2007)T/p profile (Fig. 8, top curve). The color scheme runs from zero contribution (white) to maximum contribution (black). The broad component of the spectrum is formed at relatively high pressures (deeper in the atmosphere) and typically probes a non-inverted portion of the T/p profile. On the other hand, the narrow component of the spectrum, to which we are sensitive at high resolution, probes several orders of magnitude in pressure and encompasses thermal inversion layers as well, producing molecular lines in emission.
Current usage metrics show cumulative count of Article Views (full-text article views including HTML views, PDF and ePub downloads, according to the available data) and Abstracts Views on Vision4Press platform.
Data correspond to usage on the plateform after 2015. The current usage metrics is available 48-96 hours after online publication and is updated daily on week days.
Initial download of the metrics may take a while.