Fig. 7
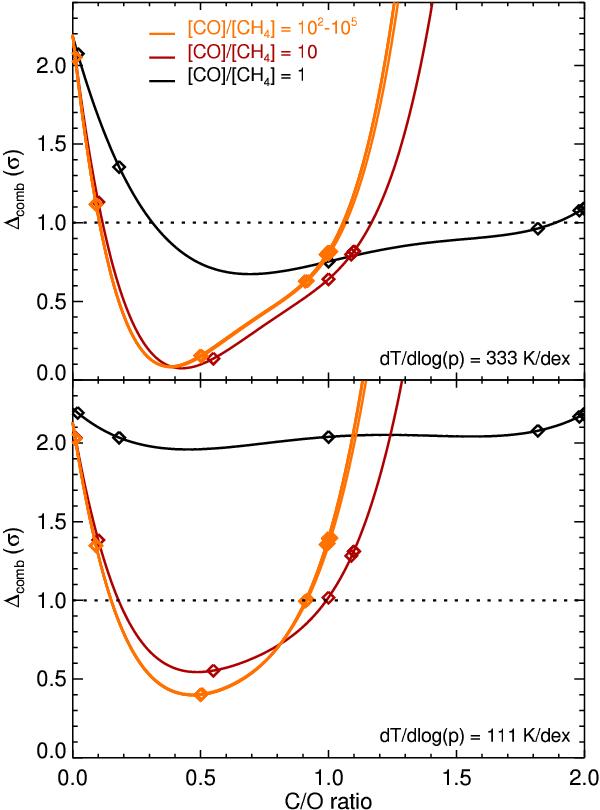
Deviation from the best-fitting model (Δcomb) as a function of C/O ratio, for atmospheric lapse rates of 333 K/dex (top panel) and 111 K/dex (bottom panel). The C/O ratio is derived from the molecular abundances according to Eq. (6). Since multiple combination of molecular abundances give approximately the same C/O ratio, here we plot curves ranging from a high methane abundance ([CO]/[CH4] = 1, black curve) to low methane abundance ([CO]/[CH4] ≥ 102, orange curve). The points are fit with fourth-order polynomials. Except for steep lapse rates with highly-abundant methane, our analysis suggests an oxygen-rich atmosphere for HD 179949 b.
Current usage metrics show cumulative count of Article Views (full-text article views including HTML views, PDF and ePub downloads, according to the available data) and Abstracts Views on Vision4Press platform.
Data correspond to usage on the plateform after 2015. The current usage metrics is available 48-96 hours after online publication and is updated daily on week days.
Initial download of the metrics may take a while.