Fig. 6
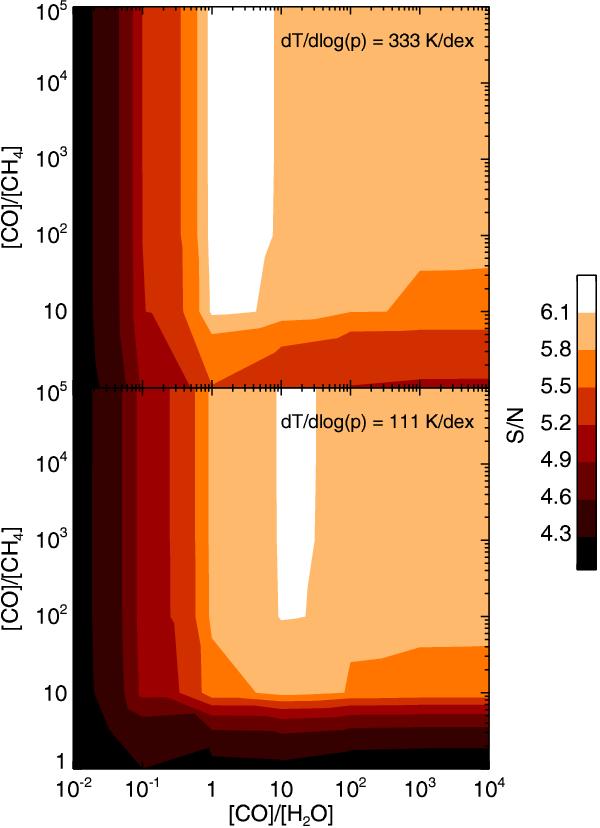
S/N of the cross-correlation signal as function of VMR(CO)/VMR(H2O) on the horizontal axis, and VMR(CO)/ VMR(CH4) on the vertical axis. The results are shown for a lapse rate of 111 K per decade in pressure (lower panel) and 333 K per decade in pressure (upper panel). These are the minimum and maximum values investigated with the atmospheric models containing CO, H2O, and CH4.
Current usage metrics show cumulative count of Article Views (full-text article views including HTML views, PDF and ePub downloads, according to the available data) and Abstracts Views on Vision4Press platform.
Data correspond to usage on the plateform after 2015. The current usage metrics is available 48-96 hours after online publication and is updated daily on week days.
Initial download of the metrics may take a while.