Fig. 5
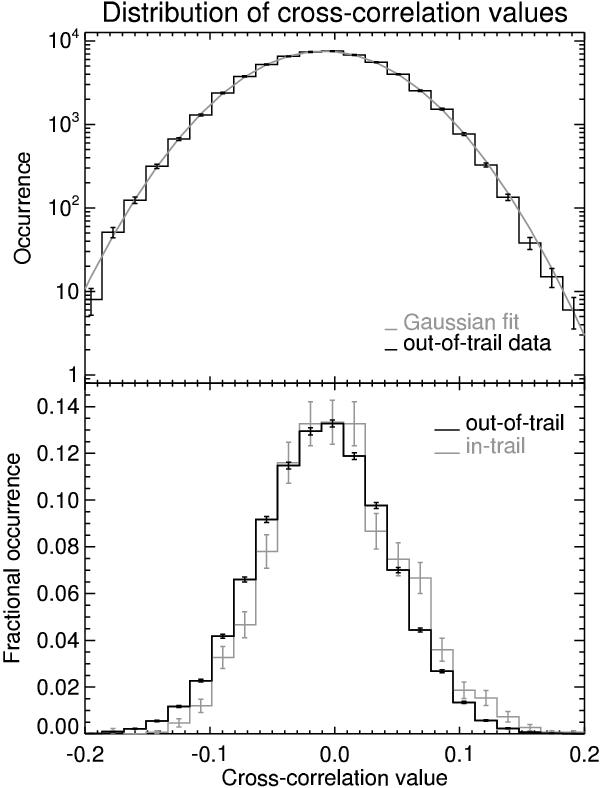
Top panel: distribution of the cross-correlation values not belonging to the planet RV curve (black histogram) compared to a Gaussian fit (gray line). The two curves are in excellent agreement across the entire range. Bottom panel: comparison between the distribution of the cross-correlation values outside and inside the planet RV trail (black and gray histograms, respectively). The latter are systematically shifted toward higher values. A Welch t-test on the data rejects the hypothesis that the two distributions are drawn from the same parent distribution at the 5.8σ of confidence level.
Current usage metrics show cumulative count of Article Views (full-text article views including HTML views, PDF and ePub downloads, according to the available data) and Abstracts Views on Vision4Press platform.
Data correspond to usage on the plateform after 2015. The current usage metrics is available 48-96 hours after online publication and is updated daily on week days.
Initial download of the metrics may take a while.