Fig. 3
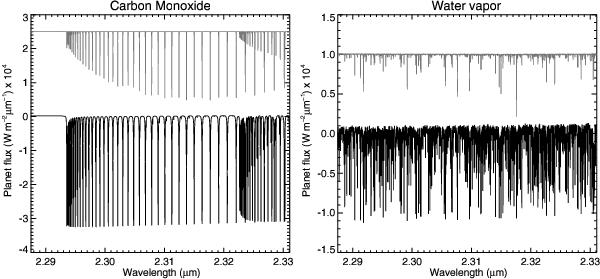
Effects of line saturation for models containing pure CO (left panel) and pure H2O (right panel). The models are continuum-subtracted and arbitrarily shifted in flux for visualization purposes. The atmospheric T/p profile is kept constant between the top and bottom models, but the molecular VMR is increased by two orders of magnitude from top to bottom, leading to saturation of the strongest lines. The same effects could be obtained by keeping the abundances constant, and increasing the lapse rate dT/dlog (p).
Current usage metrics show cumulative count of Article Views (full-text article views including HTML views, PDF and ePub downloads, according to the available data) and Abstracts Views on Vision4Press platform.
Data correspond to usage on the plateform after 2015. The current usage metrics is available 48-96 hours after online publication and is updated daily on week days.
Initial download of the metrics may take a while.