Fig. 2
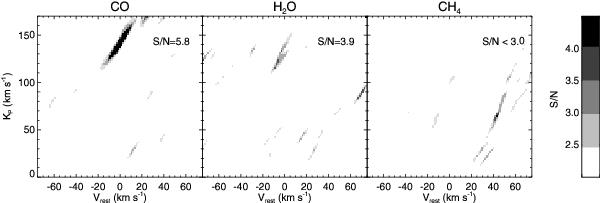
Total strength of the cross-correlation signal, as function of rest-frame velocity Vrest and planet projected orbital velocity KP, for atmospheric models containing CO only (left panel), H2O only (mid panel), and CH4 only (right panel). It shows that carbon monoxide and water vapor are detected in the atmosphere of HD 179949 b around 2.3 μm, while methane is not. The signal-to-noise is computed by dividing the value of the cross correlation at each of the positions in the diagram by the standard deviation of the cross-correlation noise. Positive and negative cross-correlation signals are both plotted.
Current usage metrics show cumulative count of Article Views (full-text article views including HTML views, PDF and ePub downloads, according to the available data) and Abstracts Views on Vision4Press platform.
Data correspond to usage on the plateform after 2015. The current usage metrics is available 48-96 hours after online publication and is updated daily on week days.
Initial download of the metrics may take a while.