Fig. 1
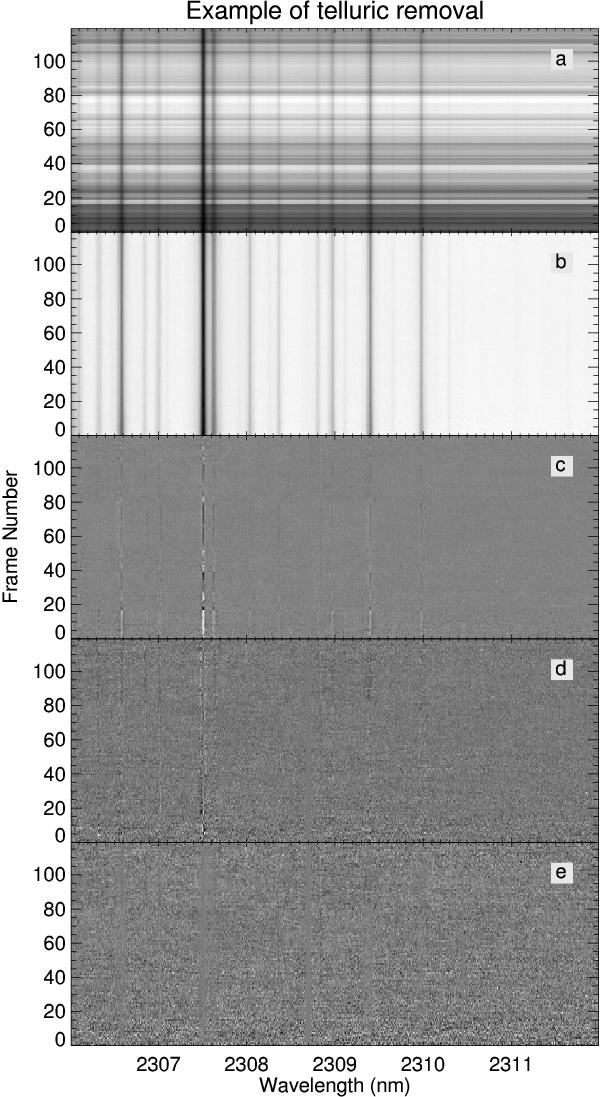
Example of telluric lines removal. Panel a) shows a sequence of 120 spectra of HD 179949 observed during the night of July 19, 2011. A small portion of detector 2 of CRIRES is shown, corresponding to the wavelength range 2306–2312 nm. The spectra are first normalized by their median value b). Subsequently, the flux in each column is divided through its linear fit with airmass c). A linear combination of the strongest residuals is utilized to detrend second-order effects d) and finally each column is normalized by its standard deviation squared e).
Current usage metrics show cumulative count of Article Views (full-text article views including HTML views, PDF and ePub downloads, according to the available data) and Abstracts Views on Vision4Press platform.
Data correspond to usage on the plateform after 2015. The current usage metrics is available 48-96 hours after online publication and is updated daily on week days.
Initial download of the metrics may take a while.