Fig. 7
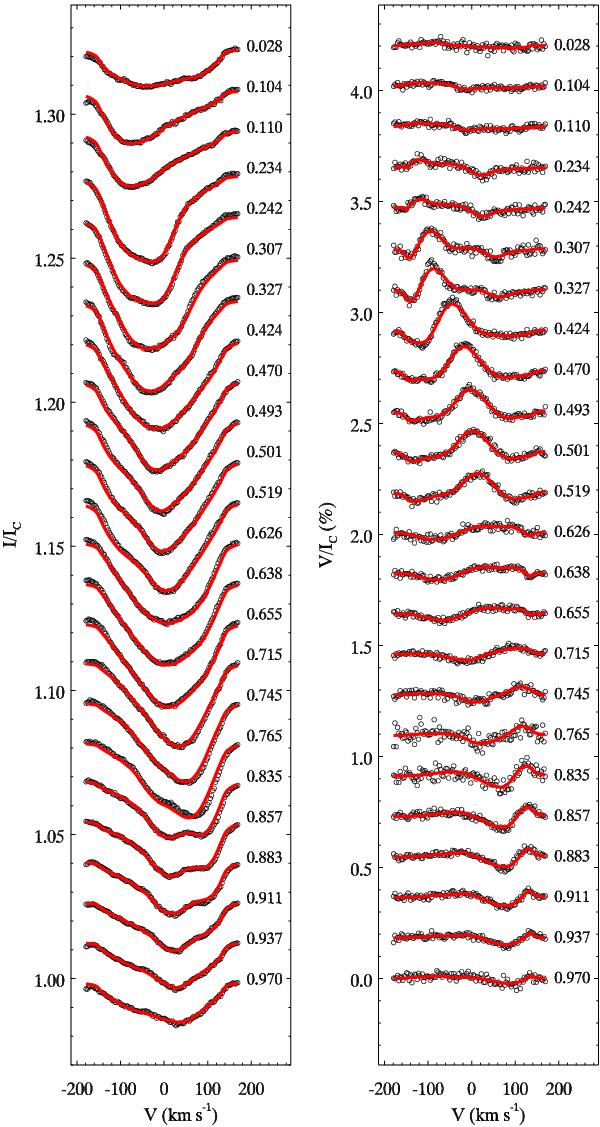
Comparison of the observed Si LSD Stokes I (left) and V (right) profiles of CU Vir with the fit achieved by the magnetic inversion code. Observations are shown with symbols. Calculations for the final surface distribution of Si spots and the best-fit magnetic field model are shown with the thick red line. Spectra corresponding to different rotation phases are offset vertically. Rotation phases are indicated to the right of each spectrum.
Current usage metrics show cumulative count of Article Views (full-text article views including HTML views, PDF and ePub downloads, according to the available data) and Abstracts Views on Vision4Press platform.
Data correspond to usage on the plateform after 2015. The current usage metrics is available 48-96 hours after online publication and is updated daily on week days.
Initial download of the metrics may take a while.