Fig. 6
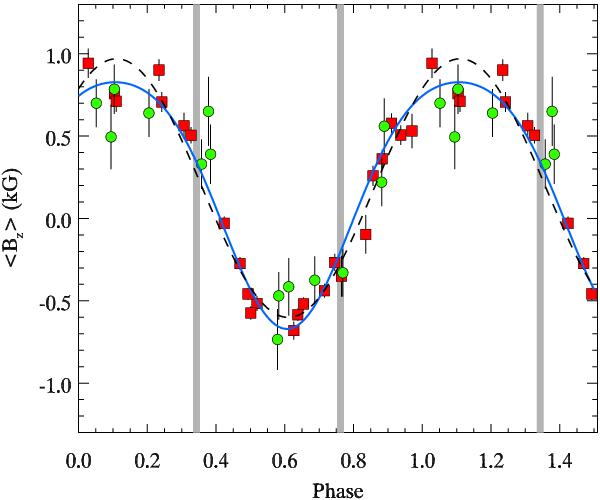
Variation of the mean longitudinal magnetic field of CU Vir. The squares show ⟨ Bz ⟩ measurements derived in this study from the LSD profiles of all metal lines. The circles show Balmer line photopolarimetric measurements by Borra & Landstreet (1980). The solid line corresponds to the fit with a dipole plus quadrupole magnetic field model. The dashed line shows predictions of the best-fitting pure dipolar model. The thick vertical grey lines indicate rotational phases of the peak radio frequency emission at 1.4 GHz.
Current usage metrics show cumulative count of Article Views (full-text article views including HTML views, PDF and ePub downloads, according to the available data) and Abstracts Views on Vision4Press platform.
Data correspond to usage on the plateform after 2015. The current usage metrics is available 48-96 hours after online publication and is updated daily on week days.
Initial download of the metrics may take a while.