Fig. 3
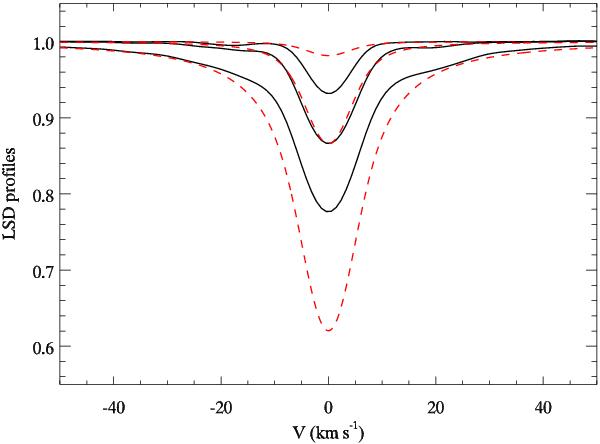
Comparison of the synthetic Si LSD profiles (solid lines) with the spectrum synthesis based on mean line parameters (dashed lines). These calculations show disk-centre local profiles for zero magnetic field and silicon abundances of [Si] = −1.0, 0.0, and +1.0 relative to the Sun. The oscillator strength and Stark damping parameter of the mean line were adjusted to fit the LSD profile corresponding to the solar Si abundance.
Current usage metrics show cumulative count of Article Views (full-text article views including HTML views, PDF and ePub downloads, according to the available data) and Abstracts Views on Vision4Press platform.
Data correspond to usage on the plateform after 2015. The current usage metrics is available 48-96 hours after online publication and is updated daily on week days.
Initial download of the metrics may take a while.