Fig. 14
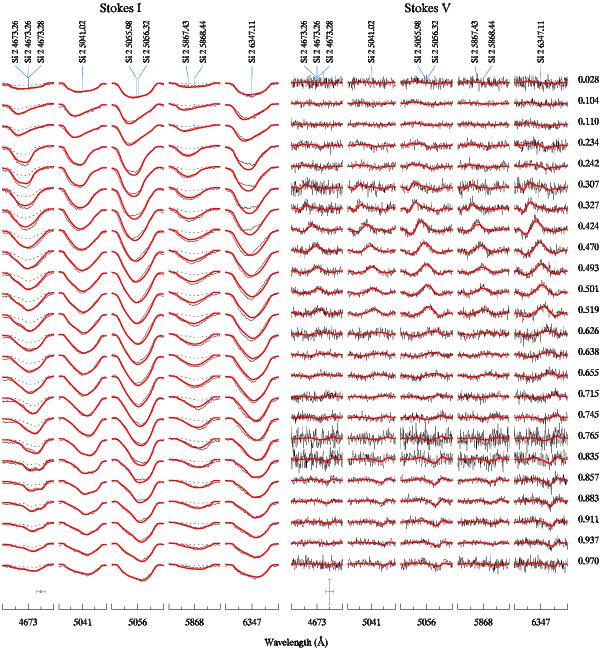
Comparison of the observed Stokes I and V profiles (thin solid line) of individual Si ii lines with the theoretical spectra (thick solid lines) as predicted by the magnetic field model and Si abundance distribution derived from silicon LSD profiles (see Figs. 9 and 13). The oscillator strengths of the high-excitation Si blends at λ 4673 and 5868 Å have been increased by 0.5–1.5 dex relative to the values given in VALD to match the observations. The spectra predicted with original oscillator strengths are shown with dotted lines. The spectra corresponding to different rotation phases (indicated to the right of the Stokes V panel) are offset vertically. The bars at the lower left corner of each panel indicate the horizontal (1 Å) and vertical (1% of Ic) scales.
Current usage metrics show cumulative count of Article Views (full-text article views including HTML views, PDF and ePub downloads, according to the available data) and Abstracts Views on Vision4Press platform.
Data correspond to usage on the plateform after 2015. The current usage metrics is available 48-96 hours after online publication and is updated daily on week days.
Initial download of the metrics may take a while.