Fig. 13
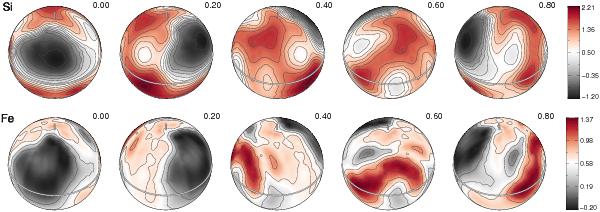
Silicon and iron surface abundance distribution that have been reconstructed from the LSD profiles of these elements simultaneously with magnetic field mapping. The star is shown at five rotational phases, as indicated next to each plot. The contours over spherical maps are plotted with a 0.25 dex step. The side bars give element abundances in logarithmic units relative to the Sun, [El] ≡ log (Nel/Ntot)⋆ − log (Nel/Ntot)⊙.
Current usage metrics show cumulative count of Article Views (full-text article views including HTML views, PDF and ePub downloads, according to the available data) and Abstracts Views on Vision4Press platform.
Data correspond to usage on the plateform after 2015. The current usage metrics is available 48-96 hours after online publication and is updated daily on week days.
Initial download of the metrics may take a while.