Fig. 10
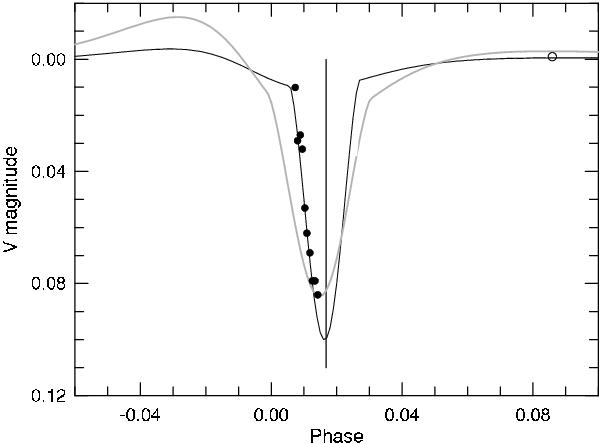
KX Vel photometry by Balona & Laing (1986). The open circle at the right represents the level of the measurements out of minimum. The black curve corresponds to the solution with i = 74.6°; the gray curve to the solution with i = 60°. The vertical line is drawn at the phase of the conjunction according to the FOTEL solution of the spectroscopy. The phase is calculated from the time of periastron.
Current usage metrics show cumulative count of Article Views (full-text article views including HTML views, PDF and ePub downloads, according to the available data) and Abstracts Views on Vision4Press platform.
Data correspond to usage on the plateform after 2015. The current usage metrics is available 48-96 hours after online publication and is updated daily on week days.
Initial download of the metrics may take a while.