Fig. 9
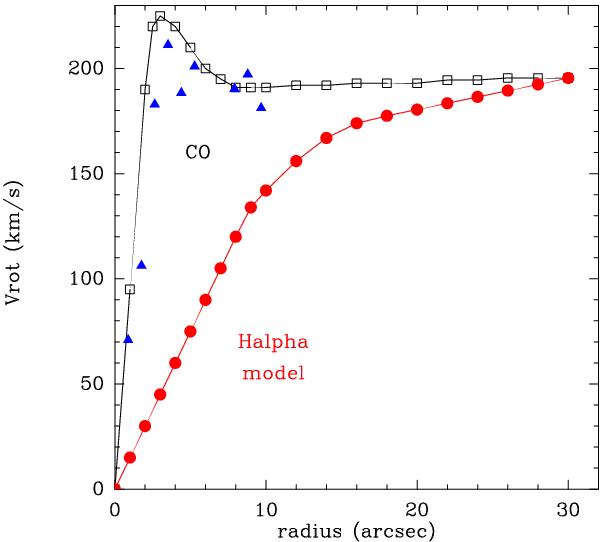
Rotational velocity model adopted for NGC 1566 (black open rectangles), based on the CO data points (blue triangles), and minimizing the residuals of Fig. 8. The Hα kinematic model from Agüero et al. (2004) is also shown in red circles. Those data were obtained with 2.̋8-wide slits, with insufficient spatial resolution to resolve the central peak. The Hα velocity model rises linearly because of the deficiency of HII regions inside a radius of 22′′ (see text).
Current usage metrics show cumulative count of Article Views (full-text article views including HTML views, PDF and ePub downloads, according to the available data) and Abstracts Views on Vision4Press platform.
Data correspond to usage on the plateform after 2015. The current usage metrics is available 48-96 hours after online publication and is updated daily on week days.
Initial download of the metrics may take a while.