Free Access
Fig. 7
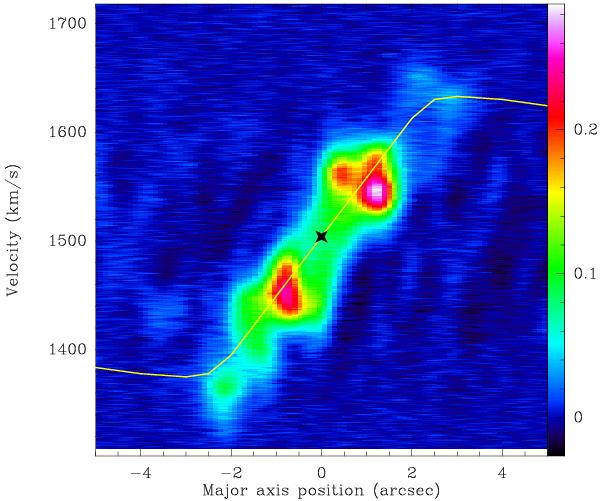
CO(3–2) position-velocity diagram along the major axis at PA = 44° (East is at left). The velocity profile is quite regular, and matches with the expected rotational velocity gradient (yellow line), as modeled in Fig. 9. The black cross indicates the adopted center.
Current usage metrics show cumulative count of Article Views (full-text article views including HTML views, PDF and ePub downloads, according to the available data) and Abstracts Views on Vision4Press platform.
Data correspond to usage on the plateform after 2015. The current usage metrics is available 48-96 hours after online publication and is updated daily on week days.
Initial download of the metrics may take a while.