Fig. 3
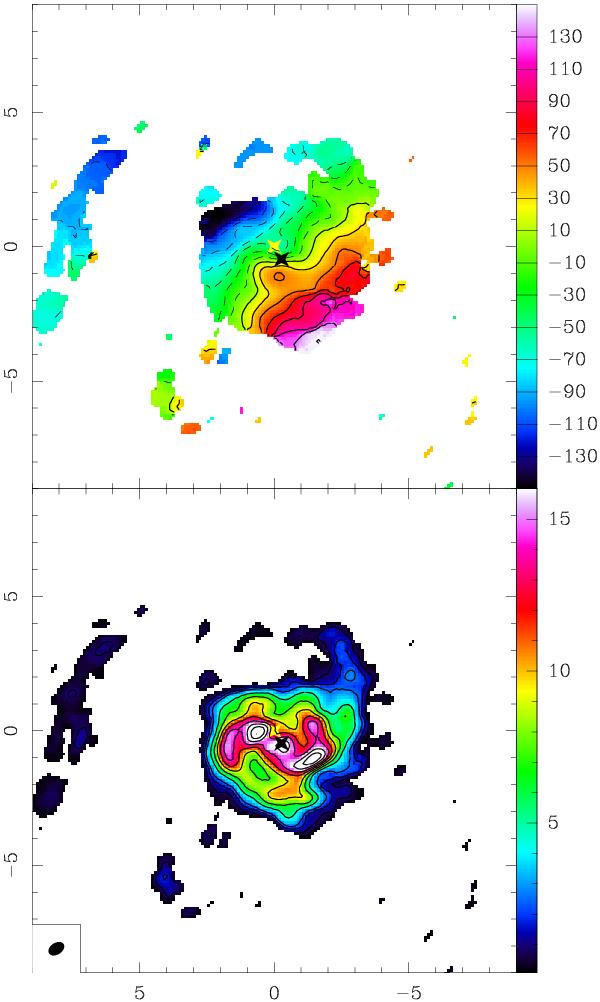
Velocity field (top) and integrated intensity (bottom) of the CO(3–2) emission in the center of NGC 1566. Coordinates are in arcsec relative to the phase center of Table 1. The latter is indicated as a yellow cross, and the new adopted center as a black cross (see Sect. 3.2). The color palettes are in km s-1 relative to Vhel = 1504 km s-1 (top) and in Jy/beam × MHz (or 0.87 Jy/beam × km s-1) at the bottom. The beam size of 0.64′′× 0.43′′ is indicated at the bottom left.
Current usage metrics show cumulative count of Article Views (full-text article views including HTML views, PDF and ePub downloads, according to the available data) and Abstracts Views on Vision4Press platform.
Data correspond to usage on the plateform after 2015. The current usage metrics is available 48-96 hours after online publication and is updated daily on week days.
Initial download of the metrics may take a while.