Fig. 2
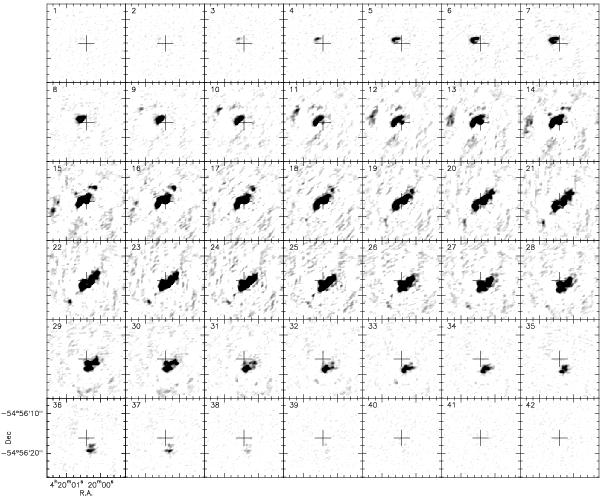
Channel maps of CO(3–2) emission in the center of NGC 1566. Each of the 42 panels is 20′′ in size. Channels are separated by 10.15 km s-1. They are plotted from Vhel = 1302 (top left) to 1718.15 km s-1 (bottom right). The synthesized beam is 0.64′′× 0.43′′ (PA = 123°). The phase center of the observations (marked by a 4′′ cross) is given in Table 1. The grey scale is linear, between 1 and 30 mJy/beam. The central channels are saturated to better show the extent of the emission.
Current usage metrics show cumulative count of Article Views (full-text article views including HTML views, PDF and ePub downloads, according to the available data) and Abstracts Views on Vision4Press platform.
Data correspond to usage on the plateform after 2015. The current usage metrics is available 48-96 hours after online publication and is updated daily on week days.
Initial download of the metrics may take a while.