Fig. 15
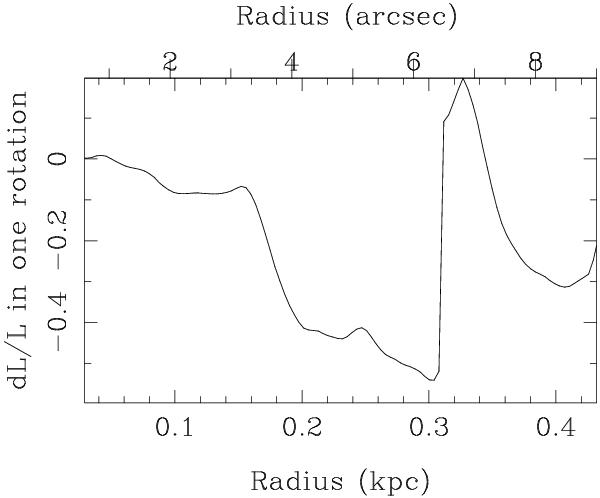
Radial distribution of the torque, quantified by the fraction of the angular momentum transferred from the gas in one rotation– dL/L, estimated from the CO(3–2) deprojected map. The forces at each point of the map were computed from the I-band HST image (see text). The torque is negative inside a 0.3 kpc radius and down to the spatial resolution of the observations. Between 6 and 9′′ from the center, there is not much CO emission and the torque estimation is noisy.
Current usage metrics show cumulative count of Article Views (full-text article views including HTML views, PDF and ePub downloads, according to the available data) and Abstracts Views on Vision4Press platform.
Data correspond to usage on the plateform after 2015. The current usage metrics is available 48-96 hours after online publication and is updated daily on week days.
Initial download of the metrics may take a while.