Fig. 14
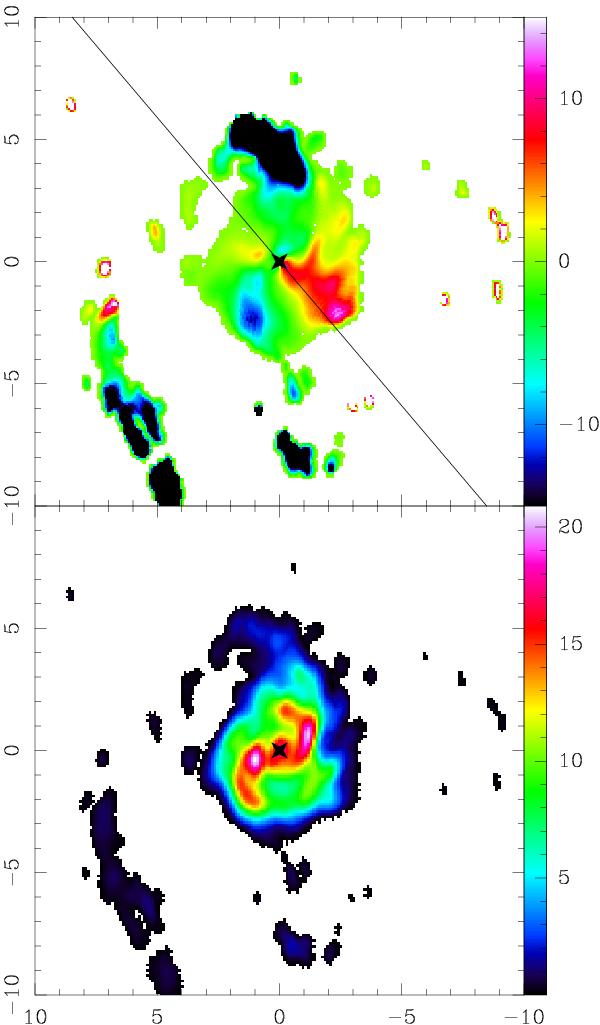
Top: map of the gravitational torque, (t(x,y) × Σ(x,y), as defined in text) in the center of NGC 1566. The torques change sign as expected in a four-quadrant pattern (or butterfly diagram). The orientation of the quadrants follows the nuclear bar’s orientation. In this deprojected picture, the major axis of the galaxy is oriented parallel to the horizontal axis. The inclined line reproduces the mean orientation of the bar (PA = 40° on the deprojected image). Bottom: deprojected image of the CO(3–2) emission, at the same scale, and with the same orientation, for comparison. The axes are labeled in arcsecond relative to the center. The color scales are linear, in arbitrary units.
Current usage metrics show cumulative count of Article Views (full-text article views including HTML views, PDF and ePub downloads, according to the available data) and Abstracts Views on Vision4Press platform.
Data correspond to usage on the plateform after 2015. The current usage metrics is available 48-96 hours after online publication and is updated daily on week days.
Initial download of the metrics may take a while.