Free Access
Fig. 10
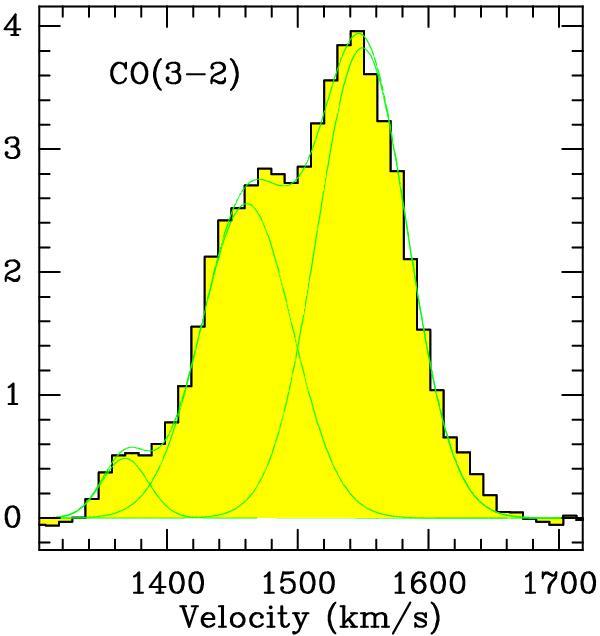
Total CO(3–2) spectrum, integrated over the observed map, with a FoV of 18′′. The vertical scale is in Jy. The green line is the result of the Gaussian fit with 3 velocity components (see Table 2). The spectrum is primary beam corrected.
Current usage metrics show cumulative count of Article Views (full-text article views including HTML views, PDF and ePub downloads, according to the available data) and Abstracts Views on Vision4Press platform.
Data correspond to usage on the plateform after 2015. The current usage metrics is available 48-96 hours after online publication and is updated daily on week days.
Initial download of the metrics may take a while.