Fig. 8
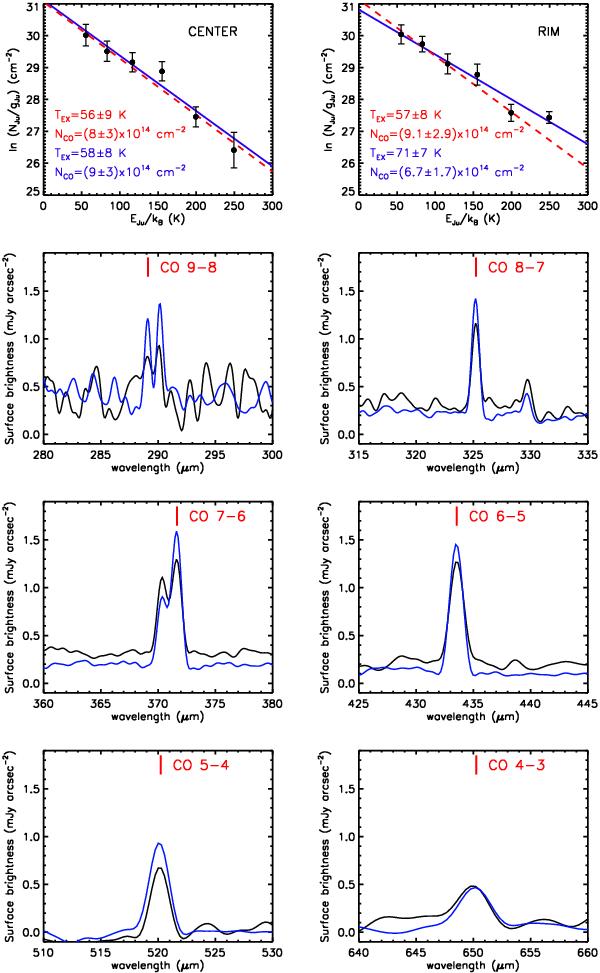
(Top two panels) CO rotation diagrams constructed from the lowest six of the observed transitions. The blue line is a fit using all six transitions and the red line is a fit without the lowest two lines with a low S/N. The left panel is of the center pointing, while the right one is of the rim pointing. Here, the beam dilution effect is not considered. (Bottom six panels) CO line profiles of the six transitions from J = 9 − 8 to J = 4 − 3 used in the analysis, extracted from the spectra taken at the central bolometer. The black line is of the center pointing, while the blue line is of the rim pointing. The two transitions not included in the second fit are CO J = 9 − 8 (highly uncertain due to low S/N) and CO J = 7 − 6 (blended with the [C i] line at 370.3 μm).
Current usage metrics show cumulative count of Article Views (full-text article views including HTML views, PDF and ePub downloads, according to the available data) and Abstracts Views on Vision4Press platform.
Data correspond to usage on the plateform after 2015. The current usage metrics is available 48-96 hours after online publication and is updated daily on week days.
Initial download of the metrics may take a while.