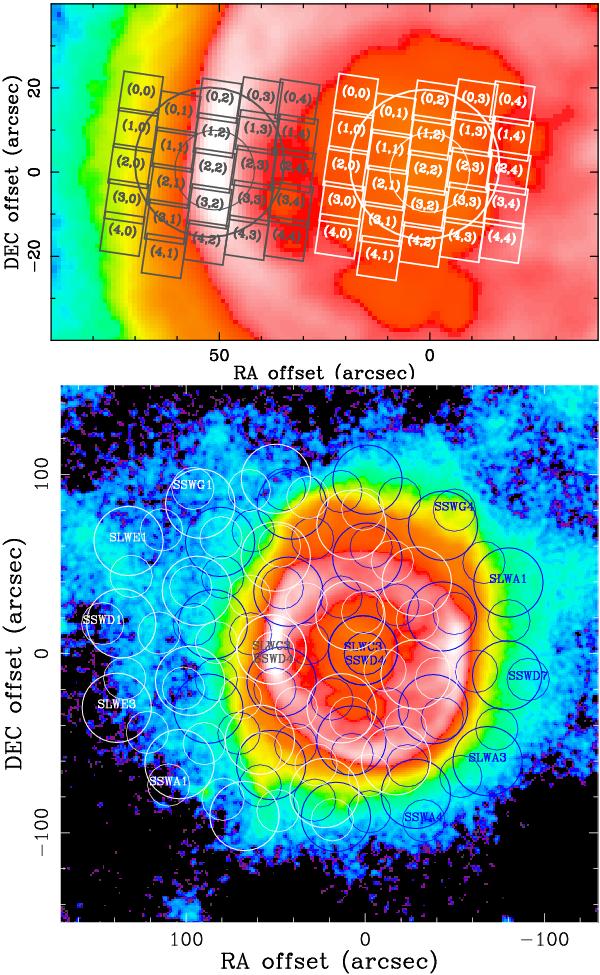
Fig. 6

(Top) Individual PACS spaxels and the central SPIRE SSW/ SLW bolometers (the smaller circles represent SSW) for each of the two pointings (center in white, rim in gray) are overlaid on the central 130′′ × 80′′ region of the PACS 70 μm image. Labels indicate specific spaxels. (Bottom) Individual SPIRE SSW/SLW bolometers for each of the two pointings (center in blue, rim in white; the smaller circles represent SSW) are overlaid on the central 290′′ × 290′′ region of the PACS 70 μm image. To specify the instrument orientation, certain bolometers are identified by their identifiers.
Current usage metrics show cumulative count of Article Views (full-text article views including HTML views, PDF and ePub downloads, according to the available data) and Abstracts Views on Vision4Press platform.
Data correspond to usage on the plateform after 2015. The current usage metrics is available 48-96 hours after online publication and is updated daily on week days.
Initial download of the metrics may take a while.


