Fig. 13
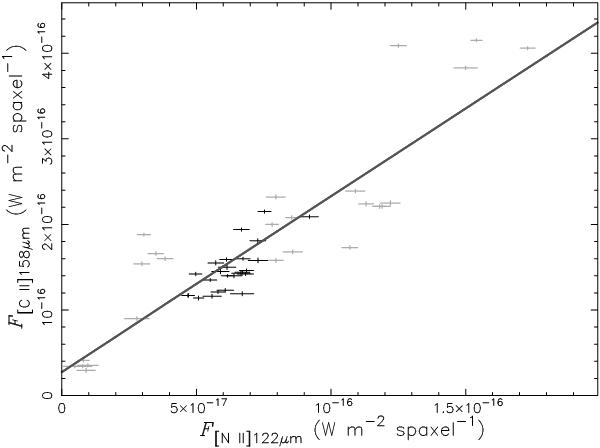
Correlation between integrated line fluxes per spaxel at [N ii] 122 μm and [C ii] 158 μm for both the center (black symbols) and rim (light-gray symbols) pointings. The sizes of these symbols indicate uncertainties. Measurements from the center pointing are clustered closer together than those from the rim pointing, suggesting that the line strength distribution is more or less uniform in the central cavity. The dark-gray line is the best-fit to the data points: F[C ii] 158 μm = (2.05 ± 0.15) × F[N ii] 122 μm + (2.74 ± 1.17) × 10-17.
Current usage metrics show cumulative count of Article Views (full-text article views including HTML views, PDF and ePub downloads, according to the available data) and Abstracts Views on Vision4Press platform.
Data correspond to usage on the plateform after 2015. The current usage metrics is available 48-96 hours after online publication and is updated daily on week days.
Initial download of the metrics may take a while.