Fig. 12
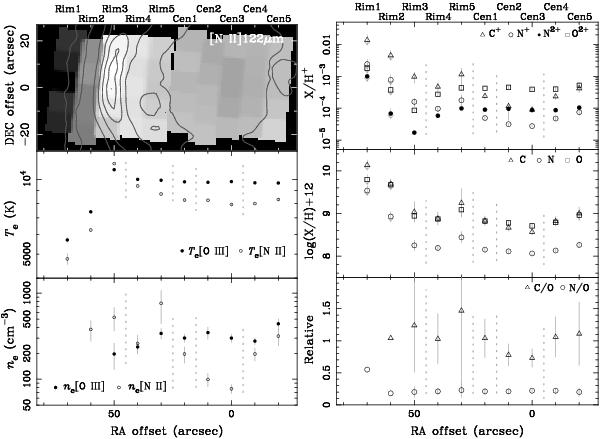
(Te, ne) and abundance profiles along the RA direction in the observed mid-eastern region of NGC 6781, designated as Cen1-Cen5 and Rim1-Rim5 as shown in Table 6. (Top left) [N ii] 122 μm line map from Fig. 11. (Middle left) log Te profiles. (Bottom left) log ne profiles. (Top right) relative ionic abundance profiles. (Middle right) relative elemental abundance profiles (where log NH = 12). (Bottom right) C/O and N/O profiles. The legend of symbols is given in each panel; filled circle: Te or ne based on [O iii], open circle: Te or ne based on [N ii], triangle: C+, log (C/H) + 12, and C/O, circle: N+ (open), N2+ (filled), log (N/H) + 12, and N/O, square: O2+ and log (O/H) + 12. The vertical gray line associated with each symbol represents uncertainties, while the vertical downward arrows indicate upper limits (all of the values at Rim1 and Rim2). Note that these values are exclusively of the H ii region of NGC 6781 (see Sect. 3.3.3). The vertical dashed gray lines indicate boundaries between stratified regions discussed in Sect. 3.3.5.
Current usage metrics show cumulative count of Article Views (full-text article views including HTML views, PDF and ePub downloads, according to the available data) and Abstracts Views on Vision4Press platform.
Data correspond to usage on the plateform after 2015. The current usage metrics is available 48-96 hours after online publication and is updated daily on week days.
Initial download of the metrics may take a while.