Fig. 11
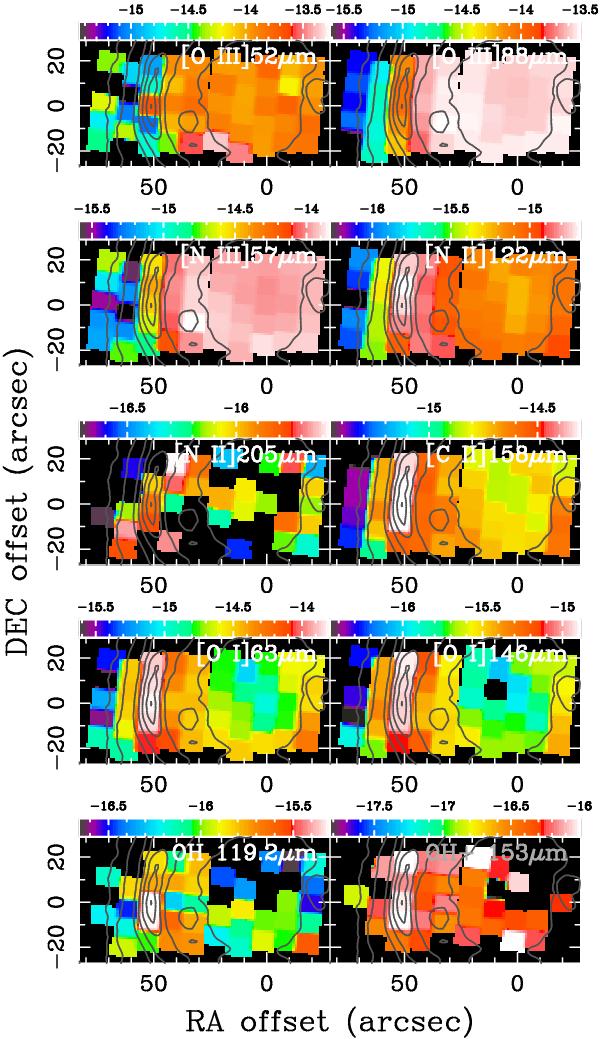
Line intensity maps covering the central 111′′ × 56′′ region of NGC 6781 at [O iii] 52, 88 μm, [N iii] 57 μm, [N ii] 122, 205 μm, [C ii] 158 μm [O i] 63, 146 μm, OH doublet 119.2, 119.4 μm, and OH+ 153 μm. Upon integrating the PACS IFU data cube over each line, the continuum level was determined using surface brightnesses on both sides of the line. Pixel values of the maps were not set unless line emission registers more than 3σ: this is why some spaxels appear to be blank (especially in the [N ii] 205 μm map). These intensity maps are overlaid with the PACS 70 μm contours (as in Fig. 3). These maps are made at 1 arcsec pix-1 so that footprints of the original PACS IFU spaxels of 9.̋4 arcsec can be seen. The color wedges show the log of the line intensity in units of erg s-1 cm-2 arcsec-2. The [N ii] map at 205 μm is scaled to have the total line intensity equal to the SPIRE measurements, because PACS flux calibration in the 205 μm region is uncertain.
Current usage metrics show cumulative count of Article Views (full-text article views including HTML views, PDF and ePub downloads, according to the available data) and Abstracts Views on Vision4Press platform.
Data correspond to usage on the plateform after 2015. The current usage metrics is available 48-96 hours after online publication and is updated daily on week days.
Initial download of the metrics may take a while.