Fig. 5
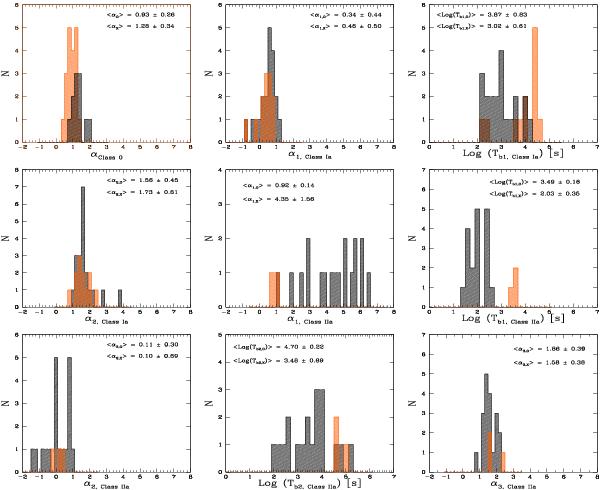
Statistics of the decay indices and break times of the X-ray (black histograms) and optical (orange histograms) light curves for classes 0, Ia, and IIa present in the complete BAT6 sample. We do not display classes Ib and IIb, since the count is less than 5 events each. In each single panel, we also report the average and the standard deviation for the plotted parameters; break times (tb1 and tb2) are of order of 103 s (as reported in Tables 2 and 3).
Current usage metrics show cumulative count of Article Views (full-text article views including HTML views, PDF and ePub downloads, according to the available data) and Abstracts Views on Vision4Press platform.
Data correspond to usage on the plateform after 2015. The current usage metrics is available 48-96 hours after online publication and is updated daily on week days.
Initial download of the metrics may take a while.