Fig. 3
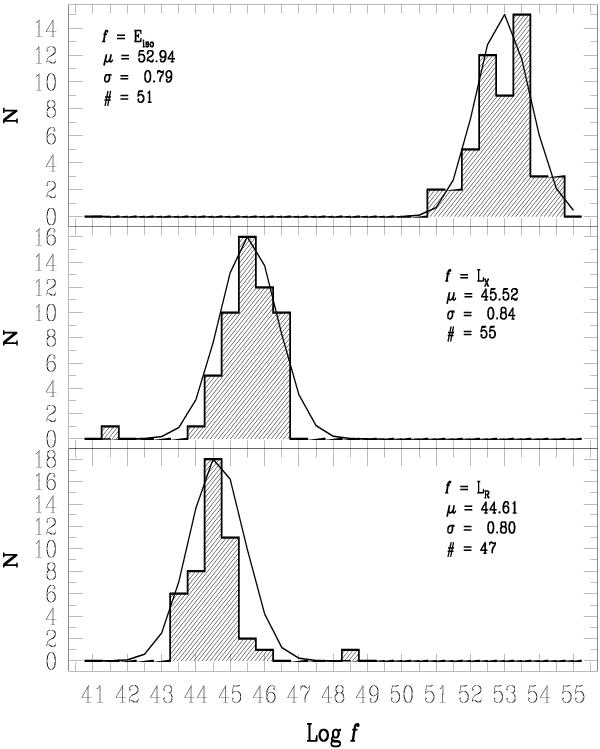
Distributions of Eiso (top), LXRT (mid), and Lopt (bottom) of the BAT6 sample for all the events with a confirmed redshift. For each histogram, we report the number of events considered (#), the mean value (μ), and dispersion (σ) of the distribution. Units on the x-axis from top to bottom are erg, erg s-1 and erg s-1, respectively.
Current usage metrics show cumulative count of Article Views (full-text article views including HTML views, PDF and ePub downloads, according to the available data) and Abstracts Views on Vision4Press platform.
Data correspond to usage on the plateform after 2015. The current usage metrics is available 48-96 hours after online publication and is updated daily on week days.
Initial download of the metrics may take a while.