Fig. 4
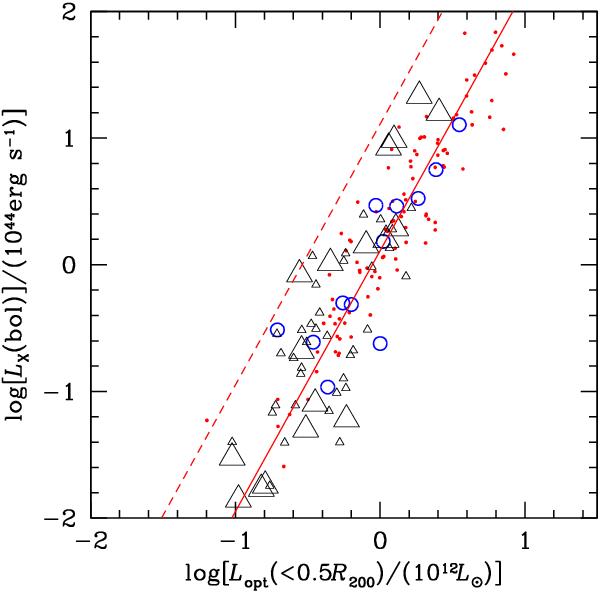
Comparison with previous literature. CONF-FGSs and CLs as in Fig. 3, but for the bolometric X-ray luminosity and the optical luminosity computed within 0.5R200. The dashed line indicates overestimates by a factor of 10 in LX(bol) or underestimates by a factor of 3 in Lopt with respect to our CL sample (red points fitted by the solid line). Large and small black triangles indicate the fossil and comparison systems in Harrison et al. (2012, see their Fig. 5).
Current usage metrics show cumulative count of Article Views (full-text article views including HTML views, PDF and ePub downloads, according to the available data) and Abstracts Views on Vision4Press platform.
Data correspond to usage on the plateform after 2015. The current usage metrics is available 48-96 hours after online publication and is updated daily on week days.
Initial download of the metrics may take a while.