Fig. 3
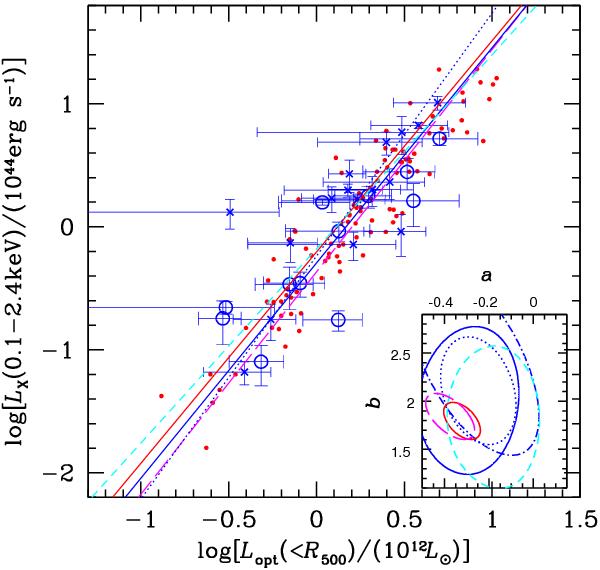
X-ray luminosity vs. r-band optical luminosity for CONF-FGSs (blue circles), NOCONF-FGSs (blue crosses), and CLs (red dots). Error bars for the CL sample are omitted. Reference values for Lopt and LX are shown. The blue solid and dotted lines indicate the fits for the CONF-FGS and ALL-FGS samples, and the red solid line is the fit for the CL sample. The magenta long-dashed and cyan dashed lines are the fits when using alternative X-ray luminosity estimates: LX,BSC/FSC values for the CL sample and LX,corr values for the CONF-FGS sample. The inset plot shows the 90% c.l. confidence ellipses corresponding to CONF-FGSs, NOCONF-FGSs, ALL-FGSs (solid, dot-dashed, and dotted blue curves), and CLs (solid red curve). Results for alternative X-ray luminosities are shown: LX,BSC/FSC for CLs (magenta long dashed curve) and LX,corr for CONF-FGSs (cyan dashed line).
Current usage metrics show cumulative count of Article Views (full-text article views including HTML views, PDF and ePub downloads, according to the available data) and Abstracts Views on Vision4Press platform.
Data correspond to usage on the plateform after 2015. The current usage metrics is available 48-96 hours after online publication and is updated daily on week days.
Initial download of the metrics may take a while.