Free Access
Fig. 8
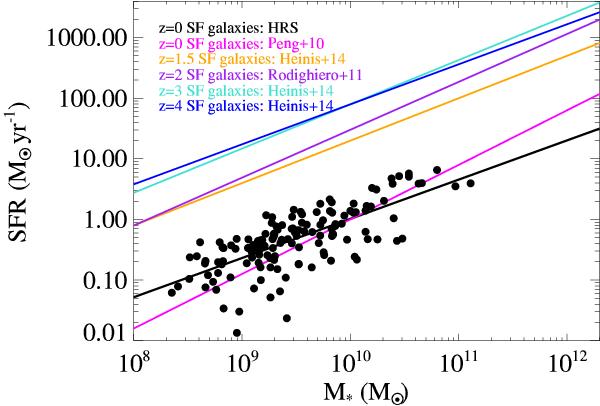
HRS galaxies placed on the SFR–M∗ plot (black dots). The best linear fit is shown as a solid black line. For comparison, other MS fits estimated at different redshifts are shown. The HRS galaxies are consistent with the relation of Peng et al. (2010), however, it seems that HRS low-mass systems have higher SFRs.
Current usage metrics show cumulative count of Article Views (full-text article views including HTML views, PDF and ePub downloads, according to the available data) and Abstracts Views on Vision4Press platform.
Data correspond to usage on the plateform after 2015. The current usage metrics is available 48-96 hours after online publication and is updated daily on week days.
Initial download of the metrics may take a while.