Fig. 7
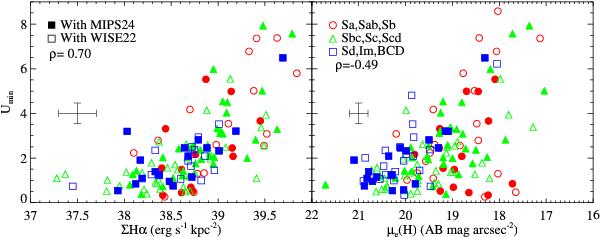
Relation between Umin, tracer of the minimum intensity of the ISRF, the Hα and H-band surface brightness (left panel and right panel, respectively). Galaxies are color-coded according their morphological type. Red: Sa-Sb; green: Sbc-Scd; and blue: Sd-BCD. Filled symbols are for galaxies with a MIPS 24 μm observations and thus a good constraint on γ. Empty symbols are for galaxies with a WISE 22 μm observations. The Spearman correlation coefficient, ρ, is provided. The cross gives the typical error bar on the data.
Current usage metrics show cumulative count of Article Views (full-text article views including HTML views, PDF and ePub downloads, according to the available data) and Abstracts Views on Vision4Press platform.
Data correspond to usage on the plateform after 2015. The current usage metrics is available 48-96 hours after online publication and is updated daily on week days.
Initial download of the metrics may take a while.