Fig. 3
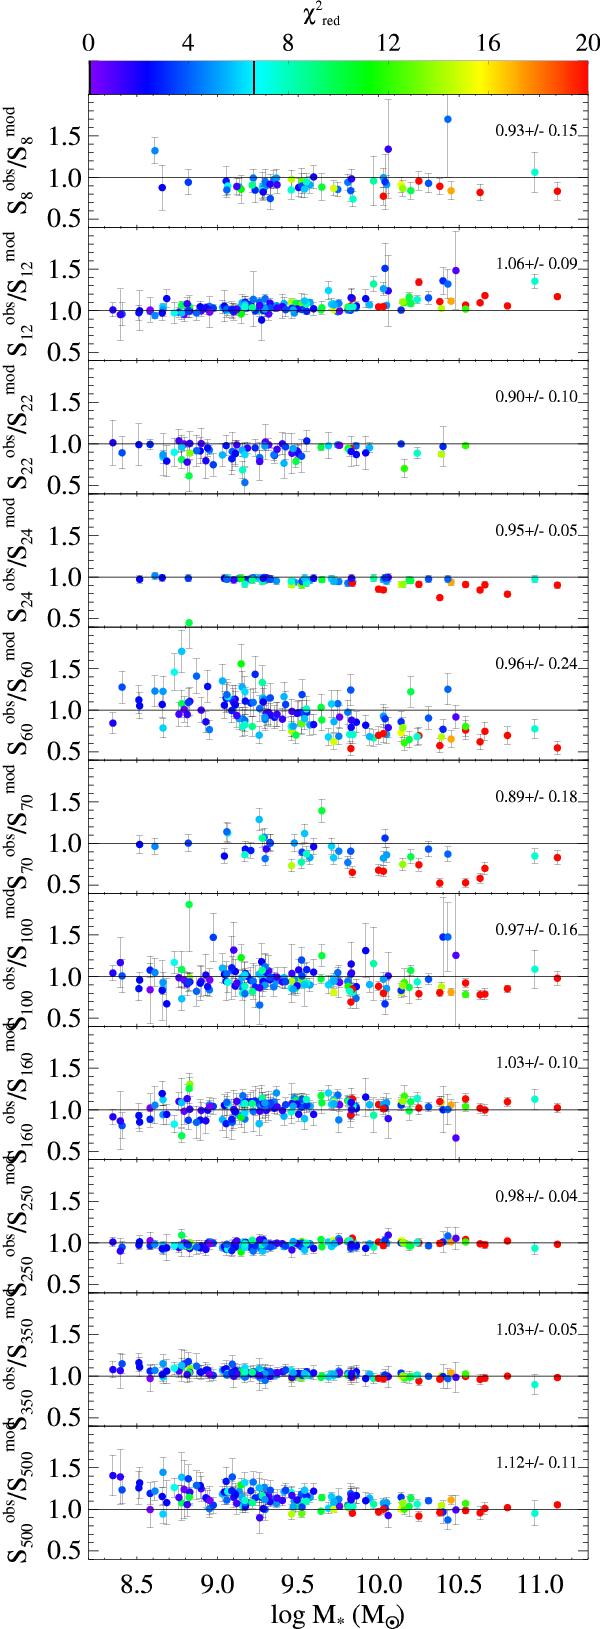
Observed to modeled flux densities ratios for every photometric band (from 8 μm, top panel, to 500 μm, bottom panel) versus the stellar mass. Points are color-coded according to the reduced χ2 associated with the fit. For each wavelength, we indicate the mean value and the standard deviation of the ratios. High-mass systems have larger χ2. DL07 models underestimate the 500 μm observations, especially for low-mass systems.
Current usage metrics show cumulative count of Article Views (full-text article views including HTML views, PDF and ePub downloads, according to the available data) and Abstracts Views on Vision4Press platform.
Data correspond to usage on the plateform after 2015. The current usage metrics is available 48-96 hours after online publication and is updated daily on week days.
Initial download of the metrics may take a while.