Free Access
Fig. A.2
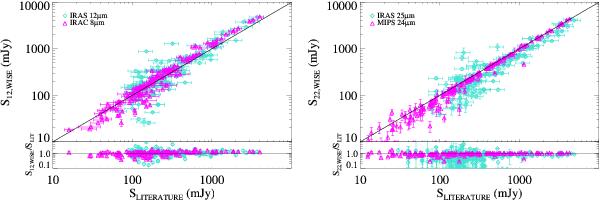
Comparison between WISE flux density measurements and NIR/MIR ancillary data available from the literature at 12 and 22 μm (left and right panels, respectively). The one-to-one relationship is the solid black line. The WISE to literature flux density ratios are shown in the lower panels.
This figure is made of several images, please see below:
Current usage metrics show cumulative count of Article Views (full-text article views including HTML views, PDF and ePub downloads, according to the available data) and Abstracts Views on Vision4Press platform.
Data correspond to usage on the plateform after 2015. The current usage metrics is available 48-96 hours after online publication and is updated daily on week days.
Initial download of the metrics may take a while.