| Issue |
A&A
Volume 565, May 2014
|
|
|---|---|---|
| Article Number | A43 | |
| Number of page(s) | 10 | |
| Section | Galactic structure, stellar clusters and populations | |
| DOI | https://doi.org/10.1051/0004-6361/201323239 | |
| Published online | 06 May 2014 | |
Precision astrometry of pulsars and other compact radio sources in the globular cluster M15
1 Max Planck Institut für Radioastronomie (MPIfR), Auf dem Hügel 69, 53121 Bonn, Germany
e-mail: This email address is being protected from spambots. You need JavaScript enabled to view it.
2 Argelander Institut für Astronomie (AIfA), University of Bonn, Auf dem Hügel 71, 53121 Bonn, Germany
3 Department of Earth and Space Sciences, Chalmers University of Technology, Onsala Space Observatory, 439 92 Onsala, Sweden
4 Joint Institute for VLBI in Europe, Oude Hoogeveensedijk 4, 7991 PD Dwingeloo, The Netherlands
Received: 12 December 2013
Accepted: 27 March 2014
Abstract
The globular cluster (GC) M15 (NGC 7078) is host to at least eight pulsars and two low mass X-ray binaries (LMXBs), one of which is also visible in the radio regime. Here we present the results of a multi-epoch global very long baseline interferometry (VLBI) campaign aiming at i) measuring the proper motion of the known compact radio sources; ii) finding and classifying thus far undetected compact radio sources in the GC; and iii) detecting a signature of the putative intermediate mass black hole (IMBH) proposed to reside at the core of M15. We measure the sky motion in right ascension (μα) and declination (μδ) of the pulsars M15A and M15C and of the LMXB AC211 to be (μα,μδ)M15A = (−0.54 ± 0.14, −4.33 ± 0.25) mas yr-1, (μα,μδ)M15C = (−0.75 ± 0.09, −3.52 ± 0.13) mas yr-1, and (μα,μδ)AC211 = (−0.46 ± 0.08, − 4.31 ± 0.20) mas yr-1, respectively. Based on these measurements we estimate the global proper motion of M15 to be (μα,μδ) = (−0.58 ± 0.18, −4.05 ± 0.34) mas yr-1. We detect two previously known but unclassified compact sources within our field of view. Our observations indicate that one them is of extragalactic origin while the other one is a foreground source, quite likely an LMXB. The double neutron star system M15C became fainter during the observations, disappeared for one year and is now observable again – an effect possibly caused by geodetic precession. The LMXB AC211 shows a double lobed structure in one of the observations indicative of an outburst during this campaign. With the inclusion of the last two of a total of seven observations we confirm the upper mass limit for a putative IMBH to be M•< 500 M⊙.
Key words: globular clusters: individual: M15 (NGC 7078) / pulsars: individual: M15A / pulsars: individual: M15C / astrometry / X-rays: individuals: 4U 2129+12 (AC211) / techniques: interferometric
Member of the International Max Planck Research School (IMPRS) for Astronomy and Astrophysics at the Universities of Bonn and Cologne
© ESO, 2014
1. Introduction
Pulsars, typically searched for and detected with single dish radio telescopes, are rapidly rotating, highly magnetized neutron stars (NSs). Their spin axis and magnetic field axis – along which relativistic charged particles are accelerated emitting cyclotron radiation – are misaligned giving rise to the pulsar phenomenon. Being very stable rotators, pulsars are used as accurate clocks to measure their intrinsic parameters such as rotation period P, spin down rate Ṗ, and position. The fastest pulsars, the so-called millisecond pulsars (MSPs, P< 30 ms), are the most stable rotators allowing for very accurate tests of theories of gravity (e.g. Antoniadis et al. 2013; Freire et al. 2012). Roughly one half of all MSPs has been found in globular clusters1 (GCs) where the frequency of stellar encounters is high, favoring the evolution of normal pulsars to MSPs through angular momentum and mass transfer in a binary system (e.g. Bhattacharya & van den Heuvel 1991). In total, about 6% of the 2302 currently known pulsars (as listed on the ATNF webpage2, Manchester et al. 2005) reside in GCs with Terzan 5 and 47 Tuc leading the field with 34 and 23 confirmed pulsars, respectively, all but one being MSPs. Despite their rotational stability, disentangling all parameters of GC pulsars through pulsar timing is sometimes difficult due to the presence of the gravitational field of the GC. In those cases, model independent measurements of intrinsic pulsar parameters such as parallax, π, and proper motion, μ, can improve the overall timing solution. The ideal way to measure π and μ purely based on geometry is through radio interferometric observations.
Details of the observations.
Here we report about multi-epoch global very long baseline interferometry (VLBI) observations of the core region (~4 arcmin) of the GC M15 (NGC 7078). This GC is one of the oldest (13.2 Gyr, McNamara et al. 2004) and most metal poor ([Fe/H] = −2.40, Sneden et al. 1997) GCs known to reside in the Galaxy. It is host to eight known pulsars (four of them being MSPs), one of which is in a binary system with another neutron star (PSR B2127+11C, Anderson et al. 1990; Anderson 1993). Four of the other seven pulsars are located in close proximity to the cluster core (within <4.5 arcsec = 0.2 pc at the distance d = 10.3 ± 0.4 kpc, van den Bosch et al. 2006) making them ideal candidates to study cluster dynamics. In the same region, two low mass X-ray binaries (LMXBs, thought of as progenitors to MSPs, e.g. Tauris & van den Heuvel 2006, and references therein) have been reported (Giacconi et al. 1974; Auriere et al. 1984; White & Angelini 2001). One of them, 4U 2129+12 (AC211), is also detectable as a compact source in the radio regime. This relatively high concentration of compact objects that have been or currently are in a binary system is already indicative of the high stellar density within the core region of M15. In fact, the observed central brightness peak and the stellar velocity dispersion profile gave rise to speculations that M15 could host an intermediate-mass black hole (IMBH, e.g. Newell et al. 1976). The predicted IMBH mass  (Gerssen et al. 2003) has, hower, been ruled out by Kirsten & Vlemmings (2012). Alternatively, a collection of ~1600 dark remnants such as stellar mass black holes, NSs, and white dwarfs in the central region of M15 could drive cluster dynamics (Baumgardt et al. 2003; McNamara et al. 2003; Murphy et al. 2011). Based on the 1.5 GHz radio luminosity and assuming a minimum pulsar luminosity of 2 μJy, Sun et al. (2002) estimate that M15 could host up to ~300 pulsars beaming towards Earth.
In this project, we accurately measure the proper motion of all compact objects detectable within our field of view and monitor their variability. Apart from the eight pulsars and the LMXB AC211, two further compact radio sources were reported previously by Machin et al. (1990) and Knapp et al. (1996). Those authors could, however, put no tight constraints on those sources’ (non-) association with the cluster. Furthermore, we look for previously undetected compact objects within the observed region that might turn out to be pulsars.
The double neutron star system M15C has shown a number of unusual glitches which need to be fitted with a number of parameters that are highly covariant with fits for the proper motion. In particular, the measurement of the orbital period decay caused by the emission of gravitational waves is influenced by an acceleration in the cluster potential and by a contribution due to a transverse motion (“Shklovskii effect”, see Lorimer & Kramer 2005). Thus determining the transverse motion of the pulsar will allow a better measurement of the line of sight acceleration of the system within the cluster potential. Once the proper motion is determined independently of any model, the covariances in the fits to the timing model can be removed, improving the measurement of all relativistic parameters.
M15A is very close to the core and has a negative period derivative, which implies it is accelerating at a fast rate in the cluster’s potential. This acceleration rate has now been shown to vary with time (Jacoby et al. 2006). The detailed variation is of great interest to investigate the gravitational potential in the cluster center, but if we have only the timing it must be disentangled from the proper motion signal. Therefore, an independent estimate of the proper motion of the pulsar will allow a much less ambiguous interpretation of the variation of the acceleration of this pulsar.
In the following we will first describe the data taking and data reduction process in Sect. 2. The data analysis strategy and the results are the subject of Sect. 3 while Sect. 4 deals with the discussion of the implications of these results. The main findings of this project are briefly summarized in Sect. 5.
2. Observations and data reduction
2.1. Observations
We observed M15 seven times at 1.6 GHz with a global VLBI array that included dishes of the European VLBI Network (EVN; Effelsberg, Jodrell Bank, Onsala, Noto, Toruǹ, Westerbork, Medicina) plus the Arecibo and the Green Bank Telescope (Table 1). The field of view (FOV) of about 2 arcmin (constrained by the Arecibo primary beam since only one dish of Westerbork was used) is large enough to cover all of the know compact sources in the cluster. The observing schedule encompassed six hours per epoch and was set up such that the target cluster M15 and the phase reference source, the quasar J2139+1423, located at ~3.17 degrees towards the north-east of the pointing center, were observed in an alternating fashion: After each 3.5 min scan of M15 we observed J2139+1423 for roughly 1.2 min. Altogether, the total integration time on M15 amounts to about 3.6 h in each of the seven epochs, roughly 1.5 h of which Arecibo was able to observe the GC. Due to technical failure no Arecibo data is available for epochs two and four.
All data were correlated at the Joint Institute for VLBI in Europe (JIVE). Epochs one to five were correlated on the EVN-MkIV correlator (Schilizzi et al. 2001) while epochs six and seven were correlated on the EVN software correlator at JIVE (SFXC3, Keimpema, in prep.). In the first epoch, the correlation center is the same as the pointing center at RA = 212958 350, Dec = 12°10′01.̋500 (J2000). In order to avoid bandwidth and time smearing the first epoch was correlated at a spectral resolution of 512 channels per each of eight intermediate frequencies (IFs, bandwidth of 16 MHz each, dual polarisation) and at a temporal resolution of 0.25 s. The size of the final data set (230 GB), however, made further data processing very slow. Consequently, subsequent epochs two to seven were still observed at the same pointing center but correlated at six different positions centered on or close to sources detected in epoch 1 (Table 2). By using a much lower spectral (128 channels per IF) and temporal (integration time 0.5 s) resolution, the size of each of the six data sets amounts to roughly 25 GB in each epoch. The FOV is ~0.75 arcmin (<10% smearing) for the individual centers which is large enough to cover most of the primary beam of Arecibo (Fig. 1).
2.2. Data reduction and calibration
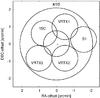 |
Fig. 1 Primary beam of the entire array (large circle, constrained by the Arecibo primary beam) and position and FOV of the six correlation centers relative to the pointing center indicated by the cross at (0, 0). The central circle with no label corresponds to the correlation center labeled AC211 in Table 2. The radius of the FOV is defined as to allow a maximal loss of 10% in the response of a point source caused by time and bandwidth smearing. |
Correlation centers throughout M15.
All data reduction and calibration steps are performed using the NRAO Astronomical Image Processing System (AIPS). The EVN pipeline4 provides the a priori system temperature and gain curve corrections as well as flags concerning off-source times and band edges. We apply these as given after which we correct the parallactic angle in CLCOR and also compute ionospheric corrections in TECOR with the help of total electron content maps as published by the Center for Orbit Determination in Europe5.
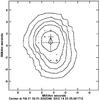 |
Fig. 2 Model of the phase calibrator used in the final calibration. For better illustration the CLEAN components used (marked by the crosses, the size of each cross indicates the relative associated flux density) were convolved with a circular beam of 2.6 mas FWHM (maximal resolution in right ascension). Contours are (10, 50, 150, 300, 900, 1800) times the rms of 0.46 mJy. Note the slightly extended structure in NE-SW direction. |
In the next step we eliminate radio frequency interference (RFI). Due to the data volume we do not flag manually but instead use the AOFlagger (Offringa et al. 2010, 2012). This software package works with measurement sets which is why we first export the a priori calibrated data sets (target source and calibrator sources individually) to a fits file which is then read into the Common Astronomy Software Application package (CASA) to produce measurement sets. After successful automatic flagging we export each measurement set back to fits format in CASA during which all flags are applied to the data. The flagged data sets are then loaded back into AIPS. These steps are performed for each calibrator source and all correlation centers individually in each epoch. In cases where entire antennas, scans, or IFs were affected by RFI our flagging-strategy was insufficient to account for it. Therefore, we perform a further manual flagging step on the data averaged over all channels in each IF.
In a first calibration step we compute bandpass solutions, phase alignments and fringe rates independently for each epoch assuming a simple point source model for the phase calibrator. In epochs 3 and 7 the data of the bandpass calibrator source, the quasar 3C 454.3, was affected by strong RFI resulting in a loss of considerable amounts of data. Therefore, for consistency reasons, we compute bandpass calibration tables from the phase calibrator source J2139+1423 using the entire time range in the individual epochs. For phase alignment between bands, we select a 30 s time interval also from a scan of the phase calibrator. After fringe fitting the data with solution intervals of 1.5 min we also self-calibrate on J2139+1423. In self-calibration we solve for both amplitude and phase at solution intervals of 1.5 min. In each epoch we detect the phase calibrator at a signal-to-noise ratio (S/N) of 800−2200.
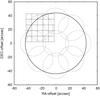 |
Fig. 3 Imaging strategy. The large solid circle indicates the FOV of one sub-center, the small dashed circles represent the relative position and the FOV of the shifted and averaged data sets. The grid of rectangles illustrates the size and relative position of each produced image. See text for details. |
For the main calibration procedure, we produce a global phase calibrator model concatenating the calibrated data of J2139+1423 of all seven epochs. We use the clean components of the image as the global model for further calibration (Fig. 2). We eventually rerun all of the calibration steps (except for self-calibration) on the phase calibrator but instead of assuming a simple point source model we apply our global model.
The angular size of the primary beam allows us to detect the strong unclassified source S1 (Machin et al. 1990; Johnston et al. 1991). This object lies ~1.5 arcmin to the west of the cluster core. We detect it at peak flux densities of 2−4 mJy beam-1; at this strength it can serve ideally as in-beam calibrator eliminating residual phase errors caused by atmospheric differences in the lines of sight to phase calibrator and target cluster. S1 is most likely of extragalactic origin (see Sect. 4.3) and, therefore, we select the image with the highest S/N (epoch 3) as model for further in-beam self-calibration. Thus the position of S1 is fixed to RA = 2129519034555, Dec = 12°10′17.̋13240. Finally, we self-calibrate all epochs applying this model.
All calibration steps are performed on the data set named S1 in Table 2. Once all solution (SN) tables are computed they are combined into one final calibration (CL) table. Since the pointing center is identical for all six correlation centers, the calibration tables obtained for one sub-center can easily be applied to the other ones speeding up data processing significantly. This is true for all epochs except epoch 1. Due to the different observational setup and correlation strategy, bandpass calibration, phase alignment and fringe rate solutions are applied to the entire data. Before self-calibration on S1 we shift the data to the six different correlation centers of the subsequent epochs. This step is done using the technique described in Morgan et al. (2011). Afterwards, we average the six data sets to the same spectral and temporal resolution as in epochs 2 to 7 and continue with self-calibration on S1.
2.3. Imaging
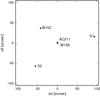 |
Fig. 4 Distribution of the detected sources relative to the pointing center. |
Details of the astrometric fits for all detected sources.
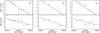 |
Fig. 5 Relative changes in positions relative to the in-beam calibrator S1 in Dec (top panels) and RA (bottom panels) for a) pulsar M15A, b) pulsar M15C, c) the LMXB AC211. The solid line is a fit to position and proper motion keeping the parallax fixed at π = 0.1. |
Once all calibration tables are applied the data of each correlation center is shifted to nine positions throughout the FOV of each correlation center using the AIPS task UVFIX. The separation in RA and Dec from the coordinates of each correlation center are 32.5 arcsec for the horizontal and vertical positions while it is 22.5 arcsec for the diagonal positions (Fig. 3). This data is averaged to 64 channels per IF and 2 sec integration time (FOV ~ 18 arcsec for <10% smearing) before imaging with natural weights. The images have a dimension of 8192 × 8192 pixels each at a resolution of 1 mas/pixel. To image one of the nine shifted and averaged data sets we produce 25 images whose central coordinates are separated by 8.1 arcsec in right ascension and declination. In total we required 25 images × 9 shifts × 6 correlation centers = 1350 images in each of seven epochs to image the entire primary beam. For source detection we also compute noise maps for each image with the AIPS task RMSD. The entire imaging process described above was done in a parallelized script written in ParselTongue (Kettenis et al. 2006).
3. Results
3.1. Detected sources
Based on the CLEANed image and its corresponding noise map the AIPS task SAD was used to search for sources down to an S/N> 4. In the following, we cross-correlate all potential candidates in between epochs allowing for a positional offset ≤25 mas. Only potential candidates found in at least three epochs were followed up for further analysis. All positions were extracted from a Gaussian fit to the brightness distribution of each source in the image plane using the AIPS task IMFIT. Figure 4 displays the distribution of the five detected sources: the two pulsars M15A (PSR B2127+11A) and M15C (PSR B2127+11C), the LMXB AC211 (4U 2129+12), and the two unclassified sources S1 and S2 (Knapp et al. 1996). Except for M15C we observe all objects in each of the seven epochs. The double neutron star system M15C was only observable in epochs 1, 3, and 7 for reasons discussed in Sect. 4.5. We fit the measured positions of all detected sources for parallax and proper motion. The results for each object are summarized in Table 3.
The two pulsars and the LMXB are known to be members of M15 while the origins of S1 and S2 are a priori unclear. Based on the well known distance of M15 (d = 10.3 ± 0.4 kpc, van den Bosch et al. 2006) we once fit for both the parallax and the proper motion and we also fit the data only for the proper motion keeping the parallax fixed at the expected value of π = 0.1 mas. In case of the three sources known to be cluster members (Fig. 5) the fit quality achieved is very similar in both approaches. Moreover, the fitted parallax is in agreement with the expected one for the given distance within the uncertainties. The positional uncertainties are estimated by the formal error, beam size/(2*S/N), which is appropriate given the close proximity to the in-beam calibrator S1, relative to which the positions were measured. The proper motion results do not change significantly regardless of whether or not we fit for the parallax. Overall, the proper motions we measure for M15A and M15C agree with those obtained from pulsar timing by Jacoby et al. (2006).
We applied the same two fitting strategies in the case of S2 where the fit to the measured positions of the source (Fig. 6) improves significantly when treating the parallax as free parameter (see Sect. 4.4).
The astrometric fits for S1 (Fig. 7) are of very poor quality regardless of fitting strategy. This is indicative of unmodeled systematic errors, especially since the high flux density of the source results in very small formal errors (~10 μas in RA and ~40 μas in Dec). Given the relatively large angular separation (~ ) between S1 and the phase calibrator relative to which the position of S1 is measured, the real uncertainties may contain a correspondingly large contribution from unmodeled differential ionospheric phase perturbations along the lines of sight to the two sources (e.g. Chatterjee et al. 2009). To reflect these the formal errors stated above should be a factor of about 50 higher. This would also be in agreement with the trend in the correlation of position uncertainties and calibrator throw as predicted by Fig. 3 in Chatterjee et al. (2004).
The implications of the fitting results for S1 and S2 are discussed in Sect. 4.
3.2. Undetected sources
Of the eight known pulsars in M15 we do not detect six. Based on the published flux densities Sν at ν = 400 MHz (Table 4) and our best sensitivity limits (rms ~ 3.5 μJy, Table 1) at ν = 1.6 GHz we can, however, derive a lower limit for the spectral index α of these sources (Sν ∝ ν− α). Taking the 4σ upper flux density limit of S1600 ≤ 14 μJy/beam we find α ≥ 1.4 for all of the undetected pulsars. In the case of the detected pulsars B2127+11A and B2127+11C our results are in agreement with the canonical value α = 1.8 ± 0.2 (Maron et al. 2000) and also with the latest analysis of the pulsar spectral index distribution suggesting α = 1.4 ± 0.96 (Bates et al. 2013). The unusually high value α ≥ 3.0 for B2127+11B lies even outside the broader distribution from Bates et al. (2013). Either the intrinsic spectral index of this pulsar is particularly steep or the catalogued flux density ν400 was affected by scintillation. Given the close proximity (≈5.7′′) of B2127+11B to B2127+11A and the fact that we do not see any evidence for scintillation for B2127+11A we exclude that our observations were affected by scintillation.
4. Discussion
4.1. Implications of proper motion measurements on peculiar velocities of cluster members
From the measured proper motions of the sources known to be cluster members (M15A, M15C, AC211) we can estimate the transverse velocities of these objects relative to the cluster. Here, we estimate the global motion of the cluster in three ways: (i) we take the average in  and
and  of all three sources; (ii) we take the proper motion of M15C because of its large angular distance from the cluster core expecting its motion to be least affected by the gravitational potential of the central mass concentration; (iii) we take the average of M15A and AC211 because of their proximity to the cluster core assuming their peculiar velocity has a radial component only. The results are summarized in Table 5.
Case (i) yields the most realistic and most conservative estimate for the global motion of the cluster. The inferred peculiar velocity of all three cluster members is well below the escape velocity of M15 (vesc ≈ 50 km s-1 at the position of M15A and AC211 and vesc ≈ 30 km s-1 at the position of M15C, Phinney 1993). We note however, that the implied peculiar velocity of M15A and AC211 is lower compared to the one of M15C. Given the close proximity of M15A and AC211 to the cluster core we would expect the opposite. Since the given global motion is based on small number statistics this might only be accidental: the peculiar velocity of M15A and AC211 seem to be very similar and, therefore, shift the average cluster motion in their favor. Alternatively, the higher peculiar velocity of M15C might only be a projection effect. The period derivative of M15A is negative indicating that the pulsar is being accelerated in the direction of the line of sight (Wolszczan et al. 1989). The same could be true for AC211 resulting in a larger 3D-velocity of M15A and AC211 than that of M15C.
Cases (ii) and (iii) yield the limiting but opposite possible transverse velocities for all three cluster members. Case (ii) implies a transverse velocity vtrans ~ 39 km s-1 for both M15A and AC211 while M15C would only have a radial velocity component. Taking the uncertainties of the proper motion into account, M15A and AC211 have a relative transverse velocity of at most  km s-1. Hence, the highest possible transverse velocity of any of the two sources
  km s-1, significantly above vesc.
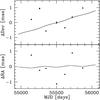 |
Fig. 7 Same as Fig. 5 but for the in-beam calibrator S1. Here, the positions are measured relative to phase calibrator and the parallax is kept as free parameter in the fit. The error bars are estimated by the formal errors and are smaller than the data points. See text for details. |
Pulsar flux densities and inferred spectral index.
Global motion of M15 and implied peculiar transverse velocities of the detected cluster members.
Case (iii) implies hardly any peculiar transverse motion of M15A and AC211 within the cluster. Given their projected distance from the core (0.06 pc and 0.07 pc for M15A and AC211, respectively) and assuming a central mass of 3400 M⊙ (van den Bosch et al. 2006) the negligible transverse velocity implies a radial velocity vr ~ 15 km s-1 if both sources are on a stable orbit around the cluster core. It is, however, very unlikely that both sources are on an orbit coinciding directly with the line of sight to M15. We conclude that case (i) is the best estimate for the global motion of M15.
Table 5 lists the previously published proper motion determinations for the GC M15 as a whole. All were based on stellar proper-motion measurements, except that of Jacoby et al. (2006), which was based on pulsar timing. The values of Cudworth & Hanson (1993) and of Jacoby et al. (2006) agree with our results within the uncertainties. The implied peculiar transverse motions of M15A, M15C, and AC211 are also below vesc. In combination with our measurements, the remaining three published results would indicate velocities relative to the cluster of about 250 km s-1 for all three cluster members discussed here. Given the cluster escape velocity we can exclude these results based on the assumption that all three compact objects are bound to M15.
4.2. Undetected pulsars in context of the pulsar luminosity function
The complementary cumulative frequency distribution function (CCFDF) of pulsar luminosities, N( ≥ , is a measure for the expected number of pulsars N brighter than the pseudo luminosity Lν = Sνd2 (Bagchi 2013, and references therein). The parameter N0 denotes the number of observable pulsars above the limiting pseudo luminosity Lν,min = 1 mJy kpc2 and β describes the power law dependence. Here, we adopt the latest results for the pulsars in M15 of
  for ν = 1400 MHz from Bagchi & Lorimer (2011). Furthermore, we convert our upper flux density limit S1600 = 14 μJy to L1400 = 1.9 mJy kpc (assuming α = 1.8 and d = 10.3 kpc). Accordingly, we estimate the number of pulsars we should have observed to N( ≥
 of which we only detect two. In comparison, Hessels et al. (2007) report a limiting pseudo luminosity L1400 = 2.1 mJy kpc2 which allows them to detect five pulsars in the GC, well consistent with the CCFDF predicting N( ≥
 . Despite our observations being more sensitive, the difference in the number of detected pulsars can be explained by the fact that Hessels et al. (2007) performed pulse searches while our data is pure continuum.
4.3. Extragalactic origin of S1
A priori, it was unclear whether the source S1 is a member of M15, a Galactic back-/foreground source or whether it is of extragalactic origin. After initial imaging and self-calibration of S1 we perform the first astrometric analysis. Figure 7 shows the position of the source relative to the phase calibrator in each epoch. The measured positions scatter about a central position with an offset of ~1 mas (= 1 pixel in the image plane). A fit to parallax, π, and proper motion, (μα,μδ), yields π = 0.04 ± 0.25 mas, (μα,μδ) = (0.05 ± 0.30, 0.53 ± 0.62) mas yr-1. With parallax and proper motion measurements consistent with zero, an extragalactic origin for S1 is the most natural conclusion. Within the uncertainty of π, however, the hypothesis that S1 is related to the cluster cannot be excluded. Therefore, we check the alternate hypothesis that S1 is a cluster member by considering its proper motion relative to that of the GC. Using case (i) from Table 5 for the GC and adding the proper-motion uncertainties for the two objects in quadrature, this relative proper motion evaluates to  mas yr-1, which in turn translates to a transverse velocity of S1 relative to the GC of
  km s-1. This value is much larger than the escape velocity at its position (24.1 km s-1<vesc< 29.3 km s-1, Phinney 1993) and rules out that S1 and M15 are related.
4.4. Galactic origin of S2
In Table 3 we list the results of both fitting strategies with and without parallax. If the parallax is kept fixed at π = 0.1 mas, suggesting S2 to be a member of M15, we measure a proper motion (μα,μδ) = ( − 0.07 ± 0.13, − 1.26 ± 0.29) mas yr-1. These values are significantly different from the ones we measure for the cluster members. Adopting our case (i) scenario for the global motion of M15 (Table 5), the measured proper motion would translate to a peculiar transverse velocity  km s-1 at PA = 10°, opposite to the direction of motion of M15 (PA = 188°). At the angular distance of S2 to the cluster core (Fig. 4, Table 3) this velocity would indicate that S2 is not bound to M15 (24.1 km s-1<vesc< 29.3 km s-1, Phinney 1993). Hence, it seems unlikely that S2 is related to the cluster.
If we take the parallax as free parameter the results for the proper motion remain the same within the uncertainties but the fit quality increases by a factor of 3. The change in  can be quantified in an F-test (e.g. Bevington 1969; Stuart & Ord 1994). Given the observed F – the ratio between the reduced chi-squares resulting from the fits in which parallax was (i) fixed at 0.1 mas and (ii) treated as a fittable parameter, which here is 2.9 – and the different numbers of degrees of freedom, ν1 = 10 (fixing π = 0.1) and ν2 = 9 (fitting for π) we can compute the probability PF of random data producing such an improvement in the value of reduced chi-square in the latter fit:
 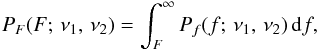 with
with ![Mathematical equation: \begin{eqnarray*} P_{f} (f;\,\nu_{1},\,\nu_{2})=\frac{\Gamma\left[\frac{\nu_{1}+\nu_{2}}{2}\right]} {\Gamma\left[\frac{\nu_{1}}{2}\right]\Gamma\left[\frac{\nu_{2}}{2}\right]}\cdot\left(\frac{\nu_{1}}{\nu_{2}}\right)^{\frac{\nu_{1}}{2}}\cdot\frac{f^{\frac{\nu_{1}-2}{2}}}{\left(1+f\frac{\nu_{1}}{\nu_{2}}\right)^{\frac{\nu_{1}+\nu_{2}}{2}}}\cdot \end{eqnarray*}](/articles/aa/full_html/2014/05/aa23239-13/aa23239-13-eq147.png) Evaluating PF(2.9; 10, 9) yields 0.062. Hence, we can reject the hypothesis of random data producing a ratio F ≥ 2.9 at the 94% confidence level. Therefore, we conclude that the measured parallax π = 0.45 ± 0.08 mas is real. This value indicates that S2 is of Galactic origin and, furthermore, that it is a foreground source at a distance
Evaluating PF(2.9; 10, 9) yields 0.062. Hence, we can reject the hypothesis of random data producing a ratio F ≥ 2.9 at the 94% confidence level. Therefore, we conclude that the measured parallax π = 0.45 ± 0.08 mas is real. This value indicates that S2 is of Galactic origin and, furthermore, that it is a foreground source at a distance  kpc. After correcting for solar motion (with the relevant solar parameters taken from Schönrich 2012) and also for differential galactic rotation (with the Oort constants A and B as published by Feast & Whitelock 1997) our measured proper motion (μα,μδ) = ( − 0.05 ± 0.08, − 1.27 ± 0.17) mas yr-1 (Fig. 6) implies a transverse velocity
  km s-1 with respect to the local standard of rest (LSR) at position angle PA = − 51°(PA in equatorial coordinates). We discuss the nature of S2 in the following section.
4.5. Variability of sources
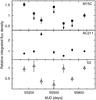 |
Fig. 8 Relative integrated flux density evolution of significantly variable sources normalized to the integrated flux density in epoch 7 (32 ± 3 μJ, 224 ± 14 μJ, 214 ± 20μJ for M15C, AC211, and S2, respectively). From top to bottom: M15C, AC211, S2. For the pulsar M15C only 4σ upper flux density limits are indicated for epochs 2, 4, 5, and 6. For AC211 in epoch 3 the flux is integrated over both components. |
M15C. The proper motion results for the double neutron star system M15C are based on three observations only (epochs 1, 3, and 7, Fig. 5b). The non-detection in epochs 2 and 4 is mostly due to the fact that those epochs were observed without the Arecibo dish which is essential to obtain the sensitivity required to detect this system. Apart from this fact, however, the measured flux density of M15C decreased between epochs 1 and 3 only to fade beyond detection as of epoch 5 (Fig. 8). In epoch 7 the pulsar was observable again. To confirm the reappearance of the source we performed single dish follow-up observations with the Arecibo telescope which had previously stopped monitoring the system due to its low flux density. Previously, regular timing observations had also revealed a steady decrease in peak flux density and also a change in pulse profile (Fig. 9, Ridolfi et al., in prep.). Our follow-up observations (bottom right panel of Fig. 9) confirm that the emission we detect in epoch 7 is related to M15C. They also reveal, however, a shift in pulse peak location that is consistent with a 2.5% phase shift observed in the timing observations (Ridolfi et al., in prep.). A possible explanation for this behavior is geodetic precession: due to orbit-spin coupling the axis of rotation of the one neutron star we see as a pulsar precesses, moving the emission region out of our line of sight. The same effect then moves a different component of the emission cone into our line of sight, which we detect at a slightly different phase.
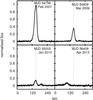 |
Fig. 9 Pulse profile evolution of M15C as observed at Arecibo. The pulsar slowly faded away over the course of about three years, probably due to geodetic precession. The vertical dotted line indicates the central location of the peak as observed until January 2010. The shift in the location of the central peak in the bottom right panel is consistent with a 2.5% phase shift observed in the timing observations (only the relevant ~10% of the pulse phase are shown here). This shift is indicative of an emission component different from the one observed up to 2010 that moved into our line of sight due to geodetic precession (Ridolfi et al., in prep.). There were no observations at Arecibo between MJD 55 202 and MJD 56 409. |
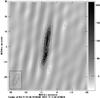 |
Fig. 10 Clean image of AC211 in epoch 3 (MJD 55 352) exhibiting the double lobed structure. Contours are (−3, 3, 5, 10, 15, 20) times the noise level rms = 9.5 μJy/beam. The beam size and position angle are shown in the bottom left corner. |
AC211. The integrated flux density of AC211 varied slightly about an average value of ~200 μJy. This is true for all observations but epoch 3. In this observation at MJD 55 352 we measure an integrated flux density Sint = 570 ± 34 μJy (Fig. 8). Moreover, in this epoch the source exhibits a double lobed structure extending from north to south (Fig. 10). We exclude the possible explanation of this structure by a phase error for two reasons. (i) When imaged, the close-by pulsar M15A (located at about 1.7 arcsec to the south-west of AC211) is an unresolved point source also in epoch 3. Any phase errors causing the observed structure in AC211 should result in a similar structure also for M15A. (ii) We can reproduce the structure independent of the data reduction and calibration strategy.
Therefore, we conclude that the observed bipolar structure is real and might have been caused by an outburst that occurred at some time between epochs 2 and 3. The X-ray data published by the MAXI mission6 (Matsuoka et al. 2009) reveals X-ray variability of M15 during our observations that could be caused by the activity of AC211 (Fig. 11).
At the distance of M15 the angular separation between the components corresponds to about 137 AU. The time span from epoch 2 to 3 is 110 days, the one from epoch 3 to 4 is 150 days. Assuming that the outburst occurred shortly after epoch 2 the transverse velocity v of the ejected material (ejected from an object in the middle of both components) would be roughly 0.6 AU per day corresponding to v ≈ 1000 km s-1. This velocity is very low compared to measured relativistic jet velocities of, e.g., the X-ray binaries SS433 (v ~ 0.2c, Stirling et al. 2002, and references therein) and GRS1915+105 (v ~ 0.98c, Fender et al. 1999, and references therein). Therefore, our measured velocity could well be real, especially if the outburst occurred at some time close to epoch 2. Turning the argument around, the outburst could have occurred only two days before our observations if we assume an ejection velocity of v ~ 0.2c.
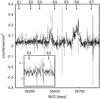 |
Fig. 11 X-ray light curve (2−20 keV) of M15 from the MAXI mission covering the time of this campaign. The inset is a zoom of the time range between epochs 2 and 3. Note the slight increase in count rate about 40 days prior to epoch 3. |
In Fender et al. (1999) it also becomes clear that the radio flux density of individual components can decrease rapidly on the timescale of a few months. Hence, the time span of 150 days from epoch 3 to 4 is long enough for the ejected material to dissipate and become undetectable again. S2. During the course of this campaign the measured flux density of S2 varied by a factor of six between ~40 and ~230 μJy (Fig. 8). Knapp et al. (1996) report a flux density of 230 ± 40 μJy at 8.4 GHz and estimate a 5σ upper limit of 150 μJy at 4.9 GHz from archival data of Machin et al. (1990). This is indicative of a compact flat spectrum source variable on the timescale of a few months, most likely an LMXB. To our knowledge, however, there are no known X-ray sources within ~1 arcmin to the coordinates of S2.
4.6. Constraints on the IMBH mass in M15
In Kirsten & Vlemmings (2012) we reported a 3σ upper mass limit for the putative IMBH in M15 of M• ≤ 500 M⊙. This work was based on the first five of the observations discussed here. In epochs 6 and 7 we also do not detect any significant emission within a radius of 0.6 arcsec (corresponding to a 3σ uncertainty) of the cluster core position at coordinates (J2000) RA = 212958330 ± 0013, Dec = 12°10′01.̋2 ± 0.̋2 (Goldsbury et al. 2010). If we concatenate the data of all seven epochs the resulting noise level improves only slightly compared to concatenating the first five epochs only (rms ~ 3.3 μJy/beam). Based on the fundamental plane of black hole activity (Merloni et al. 2003; Falcke et al. 2004; Körding et al. 2006)  which relates black hole mass, M•; radio luminosity, LR; and X-ray luminosity, LX. We therefore reconfirm the upper mass limit for the putative IMBH of M• ≤ 500 M⊙. Furthermore, our data excludes variability of any compact object residing at the center of M15 on the timescale of two months to two years.
5. Conclusions
We observed the massive globular cluster M15 in a multi-epoch global VLBI campaign in seven observations covering a time span of two years. In our observations we clearly detect five compact radio sources, namely the pulsar M15A, the double neutron star system M15C, the LMXB AC211, and two unclassified sources S1 and S2. Except for M15C (which was only detected in epochs 1, 3, and 7), all sources were detected in all seven epochs. From our proper motion measurements (Table 3) and the variability of M15C, AC211, and S2 we conclude:
-
The projected global proper motion of M15 is (μα,μδ) = (−0.58 ± 0.18, −4.05 ± 0.34) mas yr-1.
-
M15A and AC211 have a maximal transverse peculiar velocity
 km s-1 within the cluster.
 -
In epoch 3, the morphology of the LMXB AC211 is not point like but shows a double lobed structure instead. It is quite likely that the source had an outburst shortly before the observations in epoch 3.
-
M15C has a transverse velocity of at most 39 km s-1 moving towards the north in the cluster.
-
The observed 2.5% phase shift in the pulse profile points to geodetic precession as a possible explanation for the disappearance and reappearance of M15C during the observations.
-
S1 is of extragalactic origin, most probably a background quasar.
-
S2 is a Galactic foreground source at a distance
kpc moving at a transverse velocity km s-1 with respect to the LSR. -
The flux density of S2 is variable by a factor of a few on the time scale of a few months. The spectrum seems to be flat indicative of a LMXB. There is, however, no known X-ray source within about 1 arcmin of the radio position of the source.
The proper motions measured here will be important for the analysis of the timing data from M15A and M15C (Ridolfi et al., in prep.). Our model-independent measurement of the proper motion of the pulsar M15A will allow a much less ambiguous interpretation of the variation of the acceleration of this pulsar in the cluster potential. Equally, in the case of M15C, with timing only the glitch signal will be entangled with the proper motion signal. Our measurement of the proper motion will allow an unambiguous study of the rotational behavior of the pulsar.
Similar to the first five observations (Kirsten & Vlemmings 2012), in epochs 6 and 7 we do not detect any significant emission from a putative IMBH within the central 0.6 arcsec of the core region of M15. Excluding any variability of a central object on the time scale of two months to two years, we reconfirm the 3σ upper limit for the proposed central IMBH mass of M• = 500 M⊙.
For a compilation of all globular cluster pulsars see the webpage by Paulo Freire: http://www.naic.edu/~{}pfreire/GCpsr.html
http://www.atnf.csiro.au/research/pulsar/psrcat/, accessed 18 November 2013.
Acknowledgments
We appreciate the comments of the anonymous referee that helped us to improve the manuscript. We would like to thank the JIVE staff for technical support throughout the observations. Also, we appreciate the help of Adam Deller who supplied us with the code for the accurate uv-shifting without which the data of epoch 1 could not have contributed to this project. Furthermore, we acknowledge the help of André Offringa helping us in developing a suitable flagging strategy for the AOFlagger. F.K. acknowledges partial support through the Bonn-Cologne Graduate School of Physics and Astronomy. The research leading to these results has received funding from the European Commission Seventh Framework Programme (FP/2007-2013) under grant agreements No. 227290 (Advanced Radio Astronomy in Europe) and No. 283393 (RadioNet3). The European VLBI Network is a joint facility of European, Chinese, South African and other radio astronomy institutes funded by their national research councils.
References
- Anderson, S. B. 1993, Ph.D. Thesis, California Institute of Technology, USA [Google Scholar]
- Anderson, S. B., Gorham, P. W., Kulkarni, S. R., Prince, T. A., & Wolszczan, A. 1990, Nature, 346, 42 [NASA ADS] [CrossRef] [Google Scholar]
- Antoniadis, J., Freire, P. C. C., Wex, N., et al. 2013, Science, 340, 448 [Google Scholar]
- Auriere, M., Le Fevre, O., & Terzan, A. 1984, A&A, 138, 415 [NASA ADS] [Google Scholar]
- Bagchi, M. 2013, Int. J. Mod. Phys. D, 22, 30021 [NASA ADS] [Google Scholar]
- Bagchi, M., & Lorimer, D. R. 2011, in AIP Conf. Ser. 1357, eds. M. Burgay, N. D’Amico, P. Esposito, A. Pellizzoni, & A. Possenti, 173 [Google Scholar]
- Bates, S. D., Lorimer, D. R., & Verbiest, J. P. W. 2013, MNRAS, 431, 1352 [NASA ADS] [CrossRef] [Google Scholar]
- Baumgardt, H., Hut, P., Makino, J., McMillan, S., & Portegies Zwart, S. 2003, ApJ, 582, L21 [NASA ADS] [CrossRef] [Google Scholar]
- Bevington, P. R. 1969, Data reduction and error analysis for the physical sciences (New York: McGraw-Hill) [Google Scholar]
- Bhattacharya, D., & van den Heuvel, E. P. J. 1991, Phys. Rep., 203, 1 [NASA ADS] [CrossRef] [Google Scholar]
- Chatterjee, S., Cordes, J. M., Vlemmings, W. H. T., et al. 2004, ApJ, 604, 339 [NASA ADS] [CrossRef] [Google Scholar]
- Chatterjee, S., Brisken, W. F., Vlemmings, W. H. T., et al. 2009, ApJ, 698, 250 [NASA ADS] [CrossRef] [Google Scholar]
- Cudworth, K. M., & Hanson, R. B. 1993, AJ, 105, 168 [NASA ADS] [CrossRef] [Google Scholar]
- Falcke, H., Körding, E., & Markoff, S. 2004, A&A, 414, 895 [NASA ADS] [CrossRef] [EDP Sciences] [Google Scholar]
- Feast, M., & Whitelock, P. 1997, MNRAS, 291, 683 [NASA ADS] [CrossRef] [Google Scholar]
- Fender, R. P., Garrington, S. T., McKay, D. J., et al. 1999, MNRAS, 304, 865 [NASA ADS] [CrossRef] [Google Scholar]
- Freire, P. C. C., Wex, N., Esposito-Farèse, G., et al. 2012, MNRAS, 423, 3328 [NASA ADS] [CrossRef] [Google Scholar]
- Geffert, M., Colin, J., Le Campion, J.-F., & Odenkirchen, M. 1993, AJ, 106, 168 [NASA ADS] [CrossRef] [Google Scholar]
- Gerssen, J., van der Marel, R. P., Gebhardt, K., et al. 2003, AJ, 125, 376 [NASA ADS] [CrossRef] [Google Scholar]
- Giacconi, R., Murray, S., Gursky, H., et al. 1974, ApJS, 27, 37 [NASA ADS] [CrossRef] [Google Scholar]
- Goldsbury, R., Richer, H. B., Anderson, J., et al. 2010, AJ, 140, 1830 [NASA ADS] [CrossRef] [Google Scholar]
- Hessels, J. W. T., Ransom, S. M., Stairs, I. H., Kaspi, V. M., & Freire, P. C. C. 2007, ApJ, 670, 363 [NASA ADS] [CrossRef] [Google Scholar]
- Jacoby, B. A., Cameron, P. B., Jenet, F. A., et al. 2006, ApJ, 644, L113 [NASA ADS] [CrossRef] [Google Scholar]
- Johnston, H. M., Kulkarni, S. R., & Goss, W. M. 1991, ApJ, 382, L89 [NASA ADS] [CrossRef] [Google Scholar]
- Kettenis, M., van Langevelde, H. J., Reynolds, C., & Cotton, B. 2006, in Astronomical Data Analysis Software and Systems XV, eds. C. Gabriel, C. Arviset, D. Ponz, & S. Enrique, ASP Conf. Ser., 351, 497 [Google Scholar]
- Kirsten, F., & Vlemmings, W. H. T. 2012, A&A, 542, A44 [NASA ADS] [CrossRef] [EDP Sciences] [Google Scholar]
- Knapp, G. R., Gunn, J. E., Bowers, P. F., & Vasquez Poritz, J. F. 1996, ApJ, 462, 231 [NASA ADS] [CrossRef] [Google Scholar]
- Körding, E., Falcke, H., & Corbel, S. 2006, A&A, 456, 439 [NASA ADS] [CrossRef] [EDP Sciences] [Google Scholar]
- Lorimer, D. R., & Kramer, M. 2005, Handbook of Pulsar Astronomy (Cambridge University Press) [Google Scholar]
- Machin, G., Lehto, H. J., McHardy, I. M., Callanan, P. J., & Charles, P. A. 1990, MNRAS, 246, 237 [NASA ADS] [Google Scholar]
- Manchester, R. N., Hobbs, G. B., Teoh, A., & Hobbs, M. 2005, AJ, 129, 1993 [NASA ADS] [CrossRef] [Google Scholar]
- Maron, O., Kijak, J., Kramer, M., & Wielebinski, R. 2000, A&AS, 147, 195 [NASA ADS] [CrossRef] [EDP Sciences] [Google Scholar]
- Matsuoka, M., Kawasaki, K., Ueno, S., et al. 2009, PASJ, 61, 999 [NASA ADS] [CrossRef] [Google Scholar]
- McNamara, B. J., Harrison, T. E., & Anderson, J. 2003, ApJ, 595, 187 [NASA ADS] [CrossRef] [Google Scholar]
- McNamara, B. J., Harrison, T. E., & Baumgardt, H. 2004, ApJ, 602, 264 [NASA ADS] [CrossRef] [Google Scholar]
- Merloni, A., Heinz, S., & di Matteo, T. 2003, MNRAS, 345, 1057 [NASA ADS] [CrossRef] [Google Scholar]
- Morgan, J. S., Mantovani, F., Deller, A. T., et al. 2011, A&A, 526, A140 [NASA ADS] [CrossRef] [EDP Sciences] [Google Scholar]
- Murphy, B. W., Cohn, H. N., & Lugger, P. M. 2011, ApJ, 732, 67 [NASA ADS] [CrossRef] [Google Scholar]
- Newell, B., Da Costa, G. S., & Norris, J. 1976, ApJ, 208, L55 [NASA ADS] [CrossRef] [Google Scholar]
- Odenkirchen, M., Brosche, P., Geffert, M., & Tucholke, H.-J. 1997, New A, 2, 477 [Google Scholar]
- Offringa, A. R., de Bruyn, A. G., Biehl, M., et al. 2010, MNRAS, 405, 155 [NASA ADS] [Google Scholar]
- Offringa, A. R., van de Gronde, J. J., & Roerdink, J. B. T. M. 2012, A&A, 539, A95 [NASA ADS] [CrossRef] [EDP Sciences] [Google Scholar]
- Phinney, E. S. 1993, in Structure and Dynamics of Globular Clusters, eds. S. G. Djorgovski, & G. Meylan, ASP Conf. Ser., 50, 141 [Google Scholar]
- Schilizzi, R. T., Aldrich, W., Anderson, B., et al. 2001, Exp. Astron., 12, 49 [NASA ADS] [CrossRef] [Google Scholar]
- Scholz, R.-D., Odenkirchen, M., Hirte, S., et al. 1996, MNRAS, 278, 251 [NASA ADS] [CrossRef] [Google Scholar]
- Schönrich, R. 2012, MNRAS, 427, 274 [NASA ADS] [CrossRef] [Google Scholar]
- Sneden, C., Kraft, R. P., Shetrone, M. D., et al. 1997, AJ, 114, 1964 [NASA ADS] [CrossRef] [Google Scholar]
- Stirling, A. M., Jowett, F. H., Spencer, R. E., et al. 2002, MNRAS, 337, 657 [NASA ADS] [CrossRef] [Google Scholar]
- Stuart, A., & Ord, J. K. 1994, Kendall’s advanced theory of statistics, 1: Distribution theory (London: Hodder Arnold) [Google Scholar]
- Sun, X.-H., Han, J.-L., & Qiao, G.-J. 2002, Chin. J. Astron. Astrophys., 2, 133 [NASA ADS] [CrossRef] [Google Scholar]
- Tauris, T. M., & van den Heuvel, E. P. J. 2006, in Formation and evolution of compact stellar X-ray sources, eds. W. H. G. Lewin, & M. van der Klis (Cambridge: Cambridge University Press), 623 [Google Scholar]
- van den Bosch, R., de Zeeuw, T., Gebhardt, K., Noyola, E., & van de Ven, G. 2006, ApJ, 641, 852 [NASA ADS] [CrossRef] [Google Scholar]
- White, N. E., & Angelini, L. 2001, ApJ, 561, L101 [NASA ADS] [CrossRef] [Google Scholar]
- Wolszczan, A., Kulkarni, S. R., Middleditch, J., et al. 1989, Nature, 337, 531 [NASA ADS] [CrossRef] [Google Scholar]
All Tables
Global motion of M15 and implied peculiar transverse velocities of the detected cluster members.
All Figures
|
Fig. 1 Primary beam of the entire array (large circle, constrained by the Arecibo primary beam) and position and FOV of the six correlation centers relative to the pointing center indicated by the cross at (0, 0). The central circle with no label corresponds to the correlation center labeled AC211 in Table 2. The radius of the FOV is defined as to allow a maximal loss of 10% in the response of a point source caused by time and bandwidth smearing. |
| In the text | |
|
Fig. 2 Model of the phase calibrator used in the final calibration. For better illustration the CLEAN components used (marked by the crosses, the size of each cross indicates the relative associated flux density) were convolved with a circular beam of 2.6 mas FWHM (maximal resolution in right ascension). Contours are (10, 50, 150, 300, 900, 1800) times the rms of 0.46 mJy. Note the slightly extended structure in NE-SW direction. |
| In the text | |
|
Fig. 3 Imaging strategy. The large solid circle indicates the FOV of one sub-center, the small dashed circles represent the relative position and the FOV of the shifted and averaged data sets. The grid of rectangles illustrates the size and relative position of each produced image. See text for details. |
| In the text | |
|
Fig. 4 Distribution of the detected sources relative to the pointing center. |
| In the text | |
|
Fig. 5 Relative changes in positions relative to the in-beam calibrator S1 in Dec (top panels) and RA (bottom panels) for a) pulsar M15A, b) pulsar M15C, c) the LMXB AC211. The solid line is a fit to position and proper motion keeping the parallax fixed at π = 0.1. |
| In the text | |
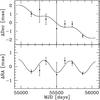 |
Fig. 6 Same as Fig. 5 but for S2. Here we kept the parallax as a free parameter. |
| In the text | |
|
Fig. 7 Same as Fig. 5 but for the in-beam calibrator S1. Here, the positions are measured relative to phase calibrator and the parallax is kept as free parameter in the fit. The error bars are estimated by the formal errors and are smaller than the data points. See text for details. |
| In the text | |
|
Fig. 8 Relative integrated flux density evolution of significantly variable sources normalized to the integrated flux density in epoch 7 (32 ± 3 μJ, 224 ± 14 μJ, 214 ± 20μJ for M15C, AC211, and S2, respectively). From top to bottom: M15C, AC211, S2. For the pulsar M15C only 4σ upper flux density limits are indicated for epochs 2, 4, 5, and 6. For AC211 in epoch 3 the flux is integrated over both components. |
| In the text | |
|
Fig. 9 Pulse profile evolution of M15C as observed at Arecibo. The pulsar slowly faded away over the course of about three years, probably due to geodetic precession. The vertical dotted line indicates the central location of the peak as observed until January 2010. The shift in the location of the central peak in the bottom right panel is consistent with a 2.5% phase shift observed in the timing observations (only the relevant ~10% of the pulse phase are shown here). This shift is indicative of an emission component different from the one observed up to 2010 that moved into our line of sight due to geodetic precession (Ridolfi et al., in prep.). There were no observations at Arecibo between MJD 55 202 and MJD 56 409. |
| In the text | |
|
Fig. 10 Clean image of AC211 in epoch 3 (MJD 55 352) exhibiting the double lobed structure. Contours are (−3, 3, 5, 10, 15, 20) times the noise level rms = 9.5 μJy/beam. The beam size and position angle are shown in the bottom left corner. |
| In the text | |
|
Fig. 11 X-ray light curve (2−20 keV) of M15 from the MAXI mission covering the time of this campaign. The inset is a zoom of the time range between epochs 2 and 3. Note the slight increase in count rate about 40 days prior to epoch 3. |
| In the text | |
Current usage metrics show cumulative count of Article Views (full-text article views including HTML views, PDF and ePub downloads, according to the available data) and Abstracts Views on Vision4Press platform.
Data correspond to usage on the plateform after 2015. The current usage metrics is available 48-96 hours after online publication and is updated daily on week days.
Initial download of the metrics may take a while.